Scandinavian vs Estonian Disability
COMPARE
Scandinavian
Estonian
Disability
Disability Comparison
Scandinavians
Estonians
12.4%
DISABILITY
0.4/ 100
METRIC RATING
261st/ 347
METRIC RANK
11.7%
DISABILITY
54.4/ 100
METRIC RATING
167th/ 347
METRIC RANK
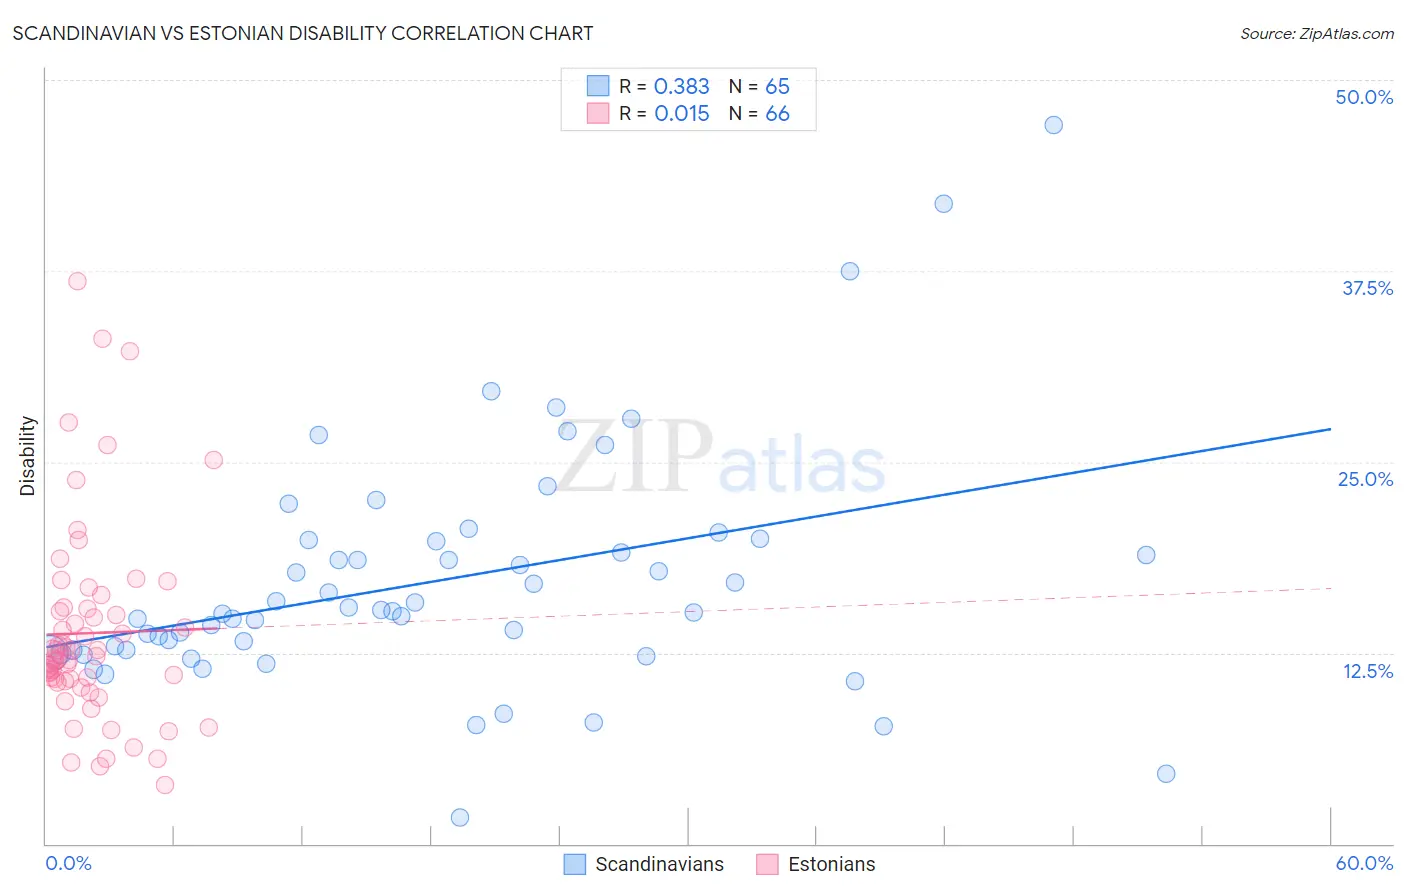
Scandinavian vs Estonian Disability Correlation Chart
The statistical analysis conducted on geographies consisting of 472,547,672 people shows a mild positive correlation between the proportion of Scandinavians and percentage of population with a disability in the United States with a correlation coefficient (R) of 0.383 and weighted average of 12.4%. Similarly, the statistical analysis conducted on geographies consisting of 123,527,631 people shows no correlation between the proportion of Estonians and percentage of population with a disability in the United States with a correlation coefficient (R) of 0.015 and weighted average of 11.7%, a difference of 6.3%.
Disability Correlation Summary
| Measurement | Scandinavian | Estonian |
| Minimum | 1.7% | 3.8% |
| Maximum | 47.1% | 36.8% |
| Range | 45.4% | 33.0% |
| Mean | 17.2% | 13.8% |
| Median | 15.2% | 12.2% |
| Interquartile 25% (IQ1) | 12.6% | 10.7% |
| Interquartile 75% (IQ3) | 19.9% | 15.4% |
| Interquartile Range (IQR) | 7.3% | 4.8% |
| Standard Deviation (Sample) | 7.9% | 6.6% |
| Standard Deviation (Population) | 7.8% | 6.5% |
Similar Demographics by Disability
Demographics Similar to Scandinavians by Disability
In terms of disability, the demographic groups most similar to Scandinavians are Immigrants from Liberia (12.4%, a difference of 0.070%), Canadian (12.4%, a difference of 0.10%), Slavic (12.4%, a difference of 0.16%), Native Hawaiian (12.5%, a difference of 0.27%), and Immigrants from Laos (12.4%, a difference of 0.30%).
| Demographics | Rating | Rank | Disability |
| German Russians | 0.8 /100 | #254 | Tragic 12.3% |
| Slovenes | 0.6 /100 | #255 | Tragic 12.4% |
| Immigrants | Dominica | 0.6 /100 | #256 | Tragic 12.4% |
| Immigrants | Laos | 0.5 /100 | #257 | Tragic 12.4% |
| Slavs | 0.5 /100 | #258 | Tragic 12.4% |
| Canadians | 0.4 /100 | #259 | Tragic 12.4% |
| Immigrants | Liberia | 0.4 /100 | #260 | Tragic 12.4% |
| Scandinavians | 0.4 /100 | #261 | Tragic 12.4% |
| Native Hawaiians | 0.3 /100 | #262 | Tragic 12.5% |
| Hawaiians | 0.2 /100 | #263 | Tragic 12.5% |
| Immigrants | Germany | 0.2 /100 | #264 | Tragic 12.5% |
| U.S. Virgin Islanders | 0.2 /100 | #265 | Tragic 12.5% |
| Czechoslovakians | 0.2 /100 | #266 | Tragic 12.5% |
| Spaniards | 0.2 /100 | #267 | Tragic 12.5% |
| Bangladeshis | 0.1 /100 | #268 | Tragic 12.6% |
Demographics Similar to Estonians by Disability
In terms of disability, the demographic groups most similar to Estonians are Pakistani (11.7%, a difference of 0.010%), Immigrants from Latin America (11.7%, a difference of 0.020%), Immigrants from Austria (11.7%, a difference of 0.050%), Immigrants from Albania (11.7%, a difference of 0.070%), and Immigrants from Southern Europe (11.7%, a difference of 0.070%).
| Demographics | Rating | Rank | Disability |
| Immigrants | Barbados | 64.2 /100 | #160 | Good 11.6% |
| Immigrants | Cuba | 62.8 /100 | #161 | Good 11.6% |
| Immigrants | Haiti | 59.2 /100 | #162 | Average 11.7% |
| Immigrants | Trinidad and Tobago | 58.9 /100 | #163 | Average 11.7% |
| Syrians | 58.5 /100 | #164 | Average 11.7% |
| Cubans | 56.7 /100 | #165 | Average 11.7% |
| Pakistanis | 54.7 /100 | #166 | Average 11.7% |
| Estonians | 54.4 /100 | #167 | Average 11.7% |
| Immigrants | Latin America | 54.1 /100 | #168 | Average 11.7% |
| Immigrants | Austria | 53.4 /100 | #169 | Average 11.7% |
| Immigrants | Albania | 52.8 /100 | #170 | Average 11.7% |
| Immigrants | Southern Europe | 52.8 /100 | #171 | Average 11.7% |
| Trinidadians and Tobagonians | 52.7 /100 | #172 | Average 11.7% |
| Maltese | 50.6 /100 | #173 | Average 11.7% |
| Albanians | 50.0 /100 | #174 | Average 11.7% |