Immigrants from Dominica vs Polish Hearing Disability
COMPARE
Immigrants from Dominica
Polish
Hearing Disability
Hearing Disability Comparison
Immigrants from Dominica
Poles
2.6%
HEARING DISABILITY
99.3/ 100
METRIC RATING
46th/ 347
METRIC RANK
3.4%
HEARING DISABILITY
0.2/ 100
METRIC RATING
255th/ 347
METRIC RANK
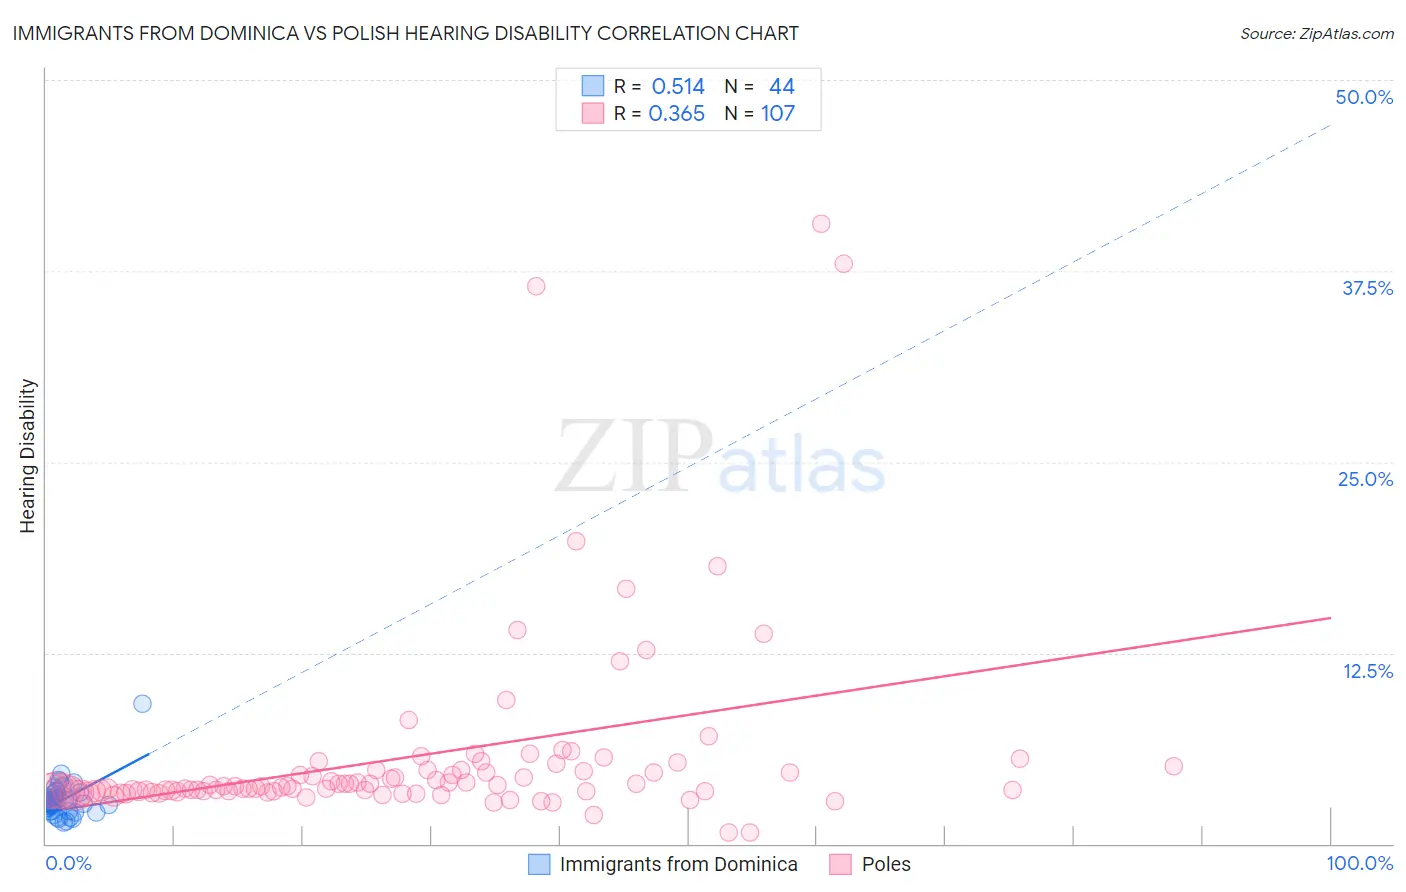
Immigrants from Dominica vs Polish Hearing Disability Correlation Chart
The statistical analysis conducted on geographies consisting of 83,776,076 people shows a substantial positive correlation between the proportion of Immigrants from Dominica and percentage of population with hearing disability in the United States with a correlation coefficient (R) of 0.514 and weighted average of 2.6%. Similarly, the statistical analysis conducted on geographies consisting of 559,927,295 people shows a mild positive correlation between the proportion of Poles and percentage of population with hearing disability in the United States with a correlation coefficient (R) of 0.365 and weighted average of 3.4%, a difference of 29.7%.
Hearing Disability Correlation Summary
| Measurement | Immigrants from Dominica | Polish |
| Minimum | 1.4% | 0.74% |
| Maximum | 9.1% | 40.6% |
| Range | 7.7% | 39.8% |
| Mean | 2.9% | 5.7% |
| Median | 2.7% | 3.7% |
| Interquartile 25% (IQ1) | 2.1% | 3.4% |
| Interquartile 75% (IQ3) | 3.2% | 4.8% |
| Interquartile Range (IQR) | 1.1% | 1.4% |
| Standard Deviation (Sample) | 1.2% | 6.4% |
| Standard Deviation (Population) | 1.2% | 6.4% |
Similar Demographics by Hearing Disability
Demographics Similar to Immigrants from Dominica by Hearing Disability
In terms of hearing disability, the demographic groups most similar to Immigrants from Dominica are Venezuelan (2.6%, a difference of 0.10%), Nigerian (2.6%, a difference of 0.13%), Immigrants from Israel (2.6%, a difference of 0.15%), Immigrants from Singapore (2.6%, a difference of 0.21%), and Immigrants from South America (2.7%, a difference of 0.34%).
| Demographics | Rating | Rank | Hearing Disability |
| Immigrants | China | 99.5 /100 | #39 | Exceptional 2.6% |
| Haitians | 99.5 /100 | #40 | Exceptional 2.6% |
| Immigrants | Taiwan | 99.4 /100 | #41 | Exceptional 2.6% |
| West Indians | 99.4 /100 | #42 | Exceptional 2.6% |
| Senegalese | 99.4 /100 | #43 | Exceptional 2.6% |
| Nigerians | 99.4 /100 | #44 | Exceptional 2.6% |
| Venezuelans | 99.4 /100 | #45 | Exceptional 2.6% |
| Immigrants | Dominica | 99.3 /100 | #46 | Exceptional 2.6% |
| Immigrants | Israel | 99.3 /100 | #47 | Exceptional 2.6% |
| Immigrants | Singapore | 99.3 /100 | #48 | Exceptional 2.6% |
| Immigrants | South America | 99.2 /100 | #49 | Exceptional 2.7% |
| Paraguayans | 99.2 /100 | #50 | Exceptional 2.7% |
| Immigrants | Hong Kong | 99.2 /100 | #51 | Exceptional 2.7% |
| Jamaicans | 99.0 /100 | #52 | Exceptional 2.7% |
| Immigrants | Eastern Asia | 99.0 /100 | #53 | Exceptional 2.7% |
Demographics Similar to Poles by Hearing Disability
In terms of hearing disability, the demographic groups most similar to Poles are Hmong (3.4%, a difference of 0.040%), Slavic (3.4%, a difference of 0.23%), Yaqui (3.4%, a difference of 0.49%), Northern European (3.4%, a difference of 0.56%), and Carpatho Rusyn (3.4%, a difference of 0.65%).
| Demographics | Rating | Rank | Hearing Disability |
| Austrians | 0.6 /100 | #248 | Tragic 3.4% |
| Italians | 0.4 /100 | #249 | Tragic 3.4% |
| Yuman | 0.4 /100 | #250 | Tragic 3.4% |
| Hungarians | 0.4 /100 | #251 | Tragic 3.4% |
| Croatians | 0.4 /100 | #252 | Tragic 3.4% |
| Carpatho Rusyns | 0.3 /100 | #253 | Tragic 3.4% |
| Slavs | 0.2 /100 | #254 | Tragic 3.4% |
| Poles | 0.2 /100 | #255 | Tragic 3.4% |
| Hmong | 0.2 /100 | #256 | Tragic 3.4% |
| Yaqui | 0.2 /100 | #257 | Tragic 3.4% |
| Northern Europeans | 0.2 /100 | #258 | Tragic 3.4% |
| Slovenes | 0.1 /100 | #259 | Tragic 3.5% |
| Portuguese | 0.1 /100 | #260 | Tragic 3.5% |
| Hawaiians | 0.1 /100 | #261 | Tragic 3.5% |
| Immigrants | North America | 0.1 /100 | #262 | Tragic 3.5% |