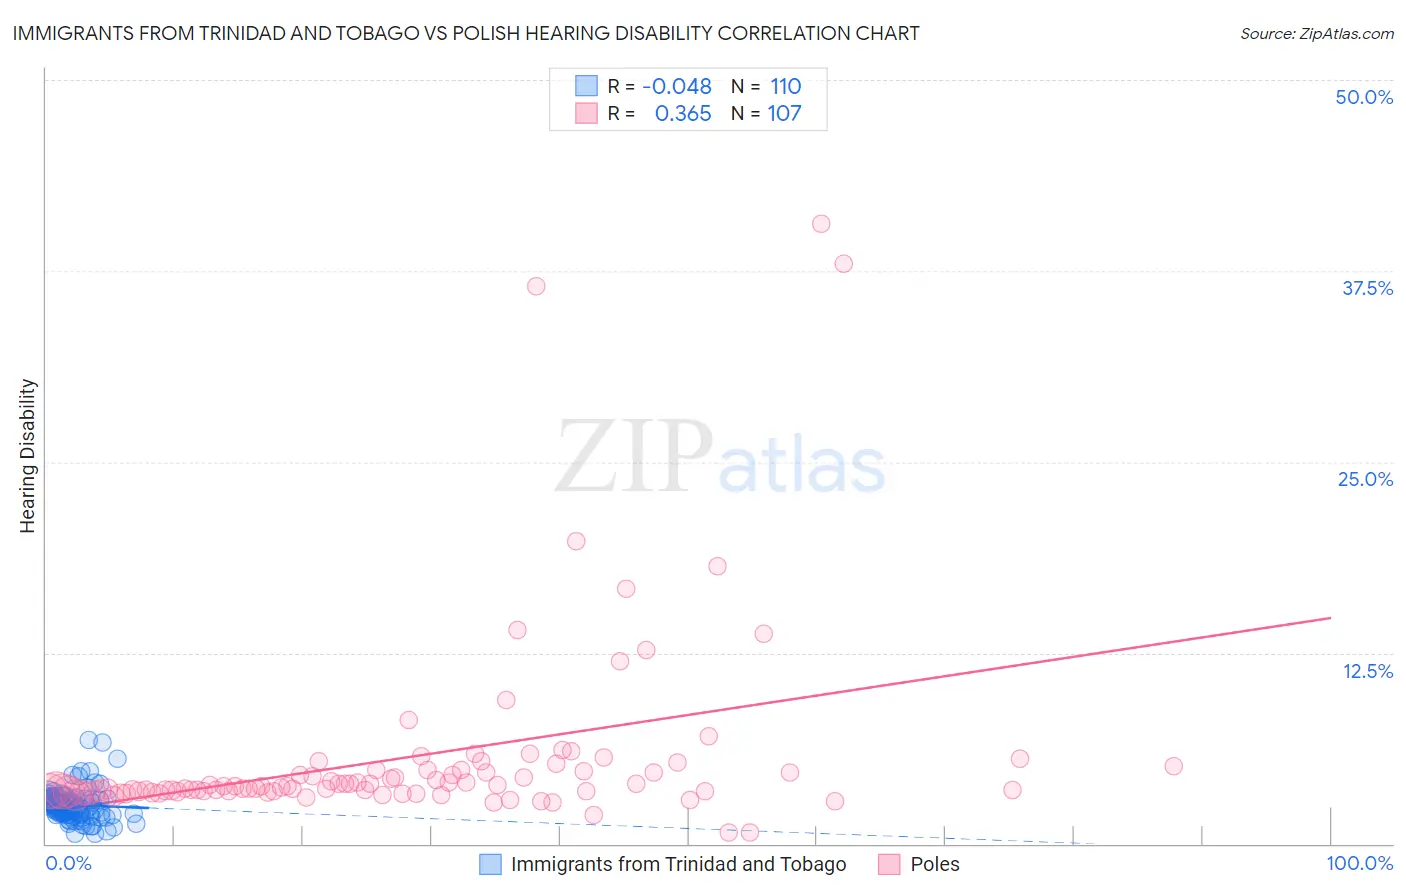
Immigrants from Trinidad and Tobago vs Polish Hearing Disability
COMPARE
Immigrants from Trinidad and Tobago
Polish
Hearing Disability
Hearing Disability Comparison
Immigrants from Trinidad and Tobago
Poles
2.5%
HEARING DISABILITY
99.9/ 100
METRIC RATING
11th/ 347
METRIC RANK
3.4%
HEARING DISABILITY
0.2/ 100
METRIC RATING
255th/ 347
METRIC RANK
Immigrants from Trinidad and Tobago vs Polish Hearing Disability Correlation Chart
The statistical analysis conducted on geographies consisting of 223,480,076 people shows no correlation between the proportion of Immigrants from Trinidad and Tobago and percentage of population with hearing disability in the United States with a correlation coefficient (R) of -0.048 and weighted average of 2.5%. Similarly, the statistical analysis conducted on geographies consisting of 559,927,295 people shows a mild positive correlation between the proportion of Poles and percentage of population with hearing disability in the United States with a correlation coefficient (R) of 0.365 and weighted average of 3.4%, a difference of 37.8%.
Hearing Disability Correlation Summary
| Measurement | Immigrants from Trinidad and Tobago | Polish |
| Minimum | 0.64% | 0.74% |
| Maximum | 6.8% | 40.6% |
| Range | 6.1% | 39.8% |
| Mean | 2.5% | 5.7% |
| Median | 2.5% | 3.7% |
| Interquartile 25% (IQ1) | 2.0% | 3.4% |
| Interquartile 75% (IQ3) | 2.9% | 4.8% |
| Interquartile Range (IQR) | 0.93% | 1.4% |
| Standard Deviation (Sample) | 1.0% | 6.4% |
| Standard Deviation (Population) | 1.0% | 6.4% |
Similar Demographics by Hearing Disability
Demographics Similar to Immigrants from Trinidad and Tobago by Hearing Disability
In terms of hearing disability, the demographic groups most similar to Immigrants from Trinidad and Tobago are Trinidadian and Tobagonian (2.5%, a difference of 0.30%), Sierra Leonean (2.5%, a difference of 0.53%), Immigrants from Ecuador (2.5%, a difference of 0.55%), Ecuadorian (2.5%, a difference of 0.85%), and Barbadian (2.5%, a difference of 1.1%).
| Demographics | Rating | Rank | Hearing Disability |
| Immigrants | Guyana | 100.0 /100 | #4 | Exceptional 2.3% |
| Immigrants | Barbados | 100.0 /100 | #5 | Exceptional 2.4% |
| Vietnamese | 100.0 /100 | #6 | Exceptional 2.4% |
| Immigrants | Bangladesh | 100.0 /100 | #7 | Exceptional 2.4% |
| British West Indians | 100.0 /100 | #8 | Exceptional 2.4% |
| Immigrants | Dominican Republic | 100.0 /100 | #9 | Exceptional 2.4% |
| Immigrants | Ecuador | 99.9 /100 | #10 | Exceptional 2.5% |
| Immigrants | Trinidad and Tobago | 99.9 /100 | #11 | Exceptional 2.5% |
| Trinidadians and Tobagonians | 99.9 /100 | #12 | Exceptional 2.5% |
| Sierra Leoneans | 99.9 /100 | #13 | Exceptional 2.5% |
| Ecuadorians | 99.9 /100 | #14 | Exceptional 2.5% |
| Barbadians | 99.9 /100 | #15 | Exceptional 2.5% |
| Immigrants | West Indies | 99.9 /100 | #16 | Exceptional 2.5% |
| Immigrants | India | 99.9 /100 | #17 | Exceptional 2.5% |
| Dominicans | 99.8 /100 | #18 | Exceptional 2.5% |
Demographics Similar to Poles by Hearing Disability
In terms of hearing disability, the demographic groups most similar to Poles are Hmong (3.4%, a difference of 0.040%), Slavic (3.4%, a difference of 0.23%), Yaqui (3.4%, a difference of 0.49%), Northern European (3.4%, a difference of 0.56%), and Carpatho Rusyn (3.4%, a difference of 0.65%).
| Demographics | Rating | Rank | Hearing Disability |
| Austrians | 0.6 /100 | #248 | Tragic 3.4% |
| Italians | 0.4 /100 | #249 | Tragic 3.4% |
| Yuman | 0.4 /100 | #250 | Tragic 3.4% |
| Hungarians | 0.4 /100 | #251 | Tragic 3.4% |
| Croatians | 0.4 /100 | #252 | Tragic 3.4% |
| Carpatho Rusyns | 0.3 /100 | #253 | Tragic 3.4% |
| Slavs | 0.2 /100 | #254 | Tragic 3.4% |
| Poles | 0.2 /100 | #255 | Tragic 3.4% |
| Hmong | 0.2 /100 | #256 | Tragic 3.4% |
| Yaqui | 0.2 /100 | #257 | Tragic 3.4% |
| Northern Europeans | 0.2 /100 | #258 | Tragic 3.4% |
| Slovenes | 0.1 /100 | #259 | Tragic 3.5% |
| Portuguese | 0.1 /100 | #260 | Tragic 3.5% |
| Hawaiians | 0.1 /100 | #261 | Tragic 3.5% |
| Immigrants | North America | 0.1 /100 | #262 | Tragic 3.5% |