Alaska Native vs Polish Hearing Disability
COMPARE
Alaska Native
Polish
Hearing Disability
Hearing Disability Comparison
Alaska Natives
Poles
4.5%
HEARING DISABILITY
0.0/ 100
METRIC RATING
338th/ 347
METRIC RANK
3.4%
HEARING DISABILITY
0.2/ 100
METRIC RATING
255th/ 347
METRIC RANK
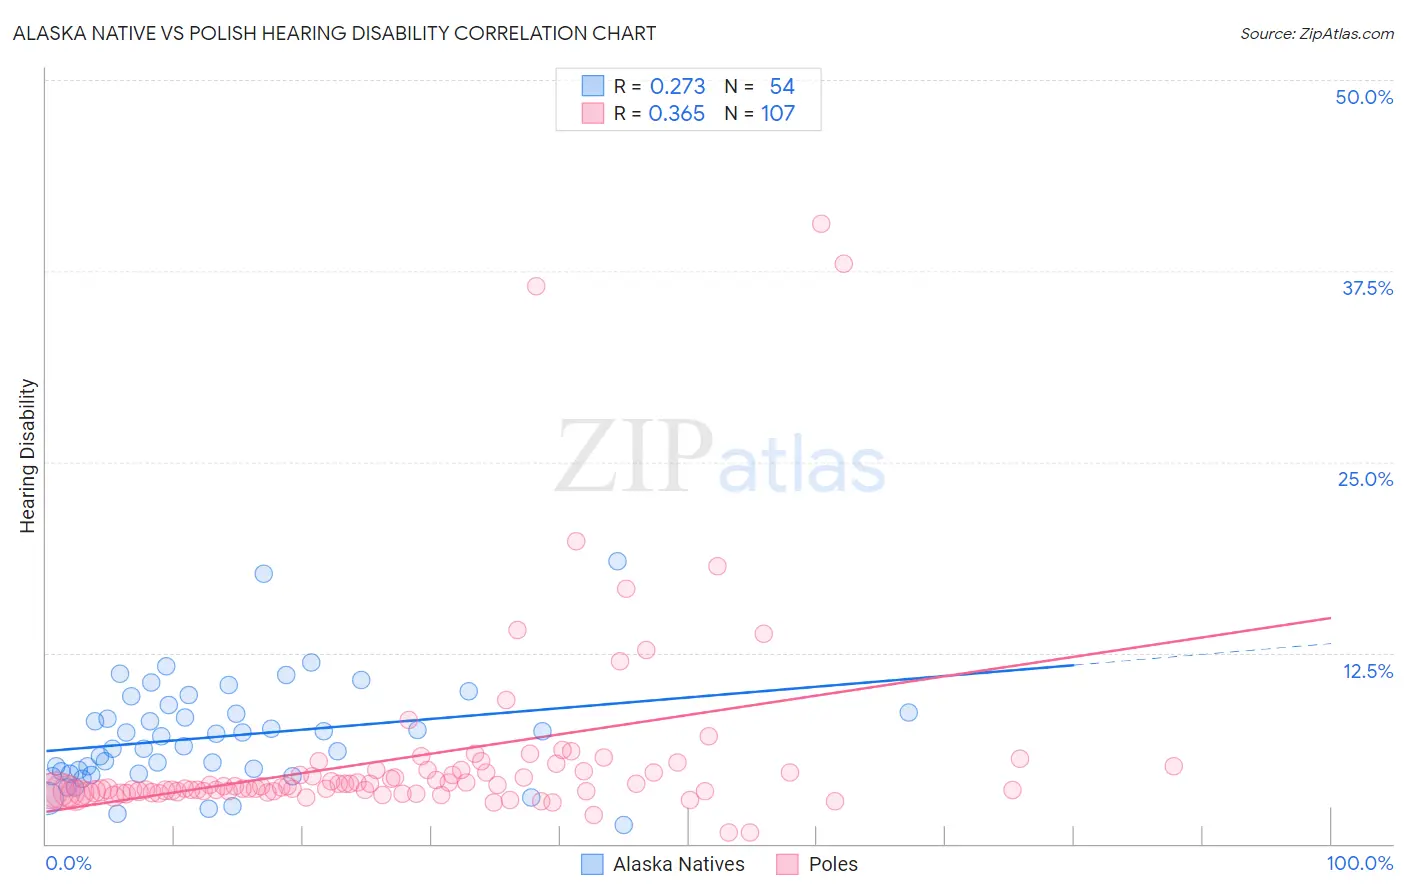
Alaska Native vs Polish Hearing Disability Correlation Chart
The statistical analysis conducted on geographies consisting of 76,760,957 people shows a weak positive correlation between the proportion of Alaska Natives and percentage of population with hearing disability in the United States with a correlation coefficient (R) of 0.273 and weighted average of 4.5%. Similarly, the statistical analysis conducted on geographies consisting of 559,927,295 people shows a mild positive correlation between the proportion of Poles and percentage of population with hearing disability in the United States with a correlation coefficient (R) of 0.365 and weighted average of 3.4%, a difference of 30.8%.
Hearing Disability Correlation Summary
| Measurement | Alaska Native | Polish |
| Minimum | 1.3% | 0.74% |
| Maximum | 18.5% | 40.6% |
| Range | 17.3% | 39.8% |
| Mean | 7.0% | 5.7% |
| Median | 6.7% | 3.7% |
| Interquartile 25% (IQ1) | 4.6% | 3.4% |
| Interquartile 75% (IQ3) | 8.6% | 4.8% |
| Interquartile Range (IQR) | 4.0% | 1.4% |
| Standard Deviation (Sample) | 3.4% | 6.4% |
| Standard Deviation (Population) | 3.4% | 6.4% |
Similar Demographics by Hearing Disability
Demographics Similar to Alaska Natives by Hearing Disability
In terms of hearing disability, the demographic groups most similar to Alaska Natives are Chickasaw (4.5%, a difference of 0.21%), Choctaw (4.5%, a difference of 1.4%), Creek (4.4%, a difference of 2.7%), Pueblo (4.6%, a difference of 2.9%), and Navajo (4.6%, a difference of 3.3%).
| Demographics | Rating | Rank | Hearing Disability |
| Cherokee | 0.0 /100 | #331 | Tragic 4.2% |
| Houma | 0.0 /100 | #332 | Tragic 4.2% |
| Dutch West Indians | 0.0 /100 | #333 | Tragic 4.3% |
| Aleuts | 0.0 /100 | #334 | Tragic 4.3% |
| Kiowa | 0.0 /100 | #335 | Tragic 4.3% |
| Creek | 0.0 /100 | #336 | Tragic 4.4% |
| Chickasaw | 0.0 /100 | #337 | Tragic 4.5% |
| Alaska Natives | 0.0 /100 | #338 | Tragic 4.5% |
| Choctaw | 0.0 /100 | #339 | Tragic 4.5% |
| Pueblo | 0.0 /100 | #340 | Tragic 4.6% |
| Navajo | 0.0 /100 | #341 | Tragic 4.6% |
| Tsimshian | 0.0 /100 | #342 | Tragic 4.7% |
| Inupiat | 0.0 /100 | #343 | Tragic 4.7% |
| Tlingit-Haida | 0.0 /100 | #344 | Tragic 4.8% |
| Alaskan Athabascans | 0.0 /100 | #345 | Tragic 5.3% |
Demographics Similar to Poles by Hearing Disability
In terms of hearing disability, the demographic groups most similar to Poles are Hmong (3.4%, a difference of 0.040%), Slavic (3.4%, a difference of 0.23%), Yaqui (3.4%, a difference of 0.49%), Northern European (3.4%, a difference of 0.56%), and Carpatho Rusyn (3.4%, a difference of 0.65%).
| Demographics | Rating | Rank | Hearing Disability |
| Austrians | 0.6 /100 | #248 | Tragic 3.4% |
| Italians | 0.4 /100 | #249 | Tragic 3.4% |
| Yuman | 0.4 /100 | #250 | Tragic 3.4% |
| Hungarians | 0.4 /100 | #251 | Tragic 3.4% |
| Croatians | 0.4 /100 | #252 | Tragic 3.4% |
| Carpatho Rusyns | 0.3 /100 | #253 | Tragic 3.4% |
| Slavs | 0.2 /100 | #254 | Tragic 3.4% |
| Poles | 0.2 /100 | #255 | Tragic 3.4% |
| Hmong | 0.2 /100 | #256 | Tragic 3.4% |
| Yaqui | 0.2 /100 | #257 | Tragic 3.4% |
| Northern Europeans | 0.2 /100 | #258 | Tragic 3.4% |
| Slovenes | 0.1 /100 | #259 | Tragic 3.5% |
| Portuguese | 0.1 /100 | #260 | Tragic 3.5% |
| Hawaiians | 0.1 /100 | #261 | Tragic 3.5% |
| Immigrants | North America | 0.1 /100 | #262 | Tragic 3.5% |