Armenian vs Polish Hearing Disability
COMPARE
Armenian
Polish
Hearing Disability
Hearing Disability Comparison
Armenians
Poles
3.0%
HEARING DISABILITY
56.0/ 100
METRIC RATING
172nd/ 347
METRIC RANK
3.4%
HEARING DISABILITY
0.2/ 100
METRIC RATING
255th/ 347
METRIC RANK
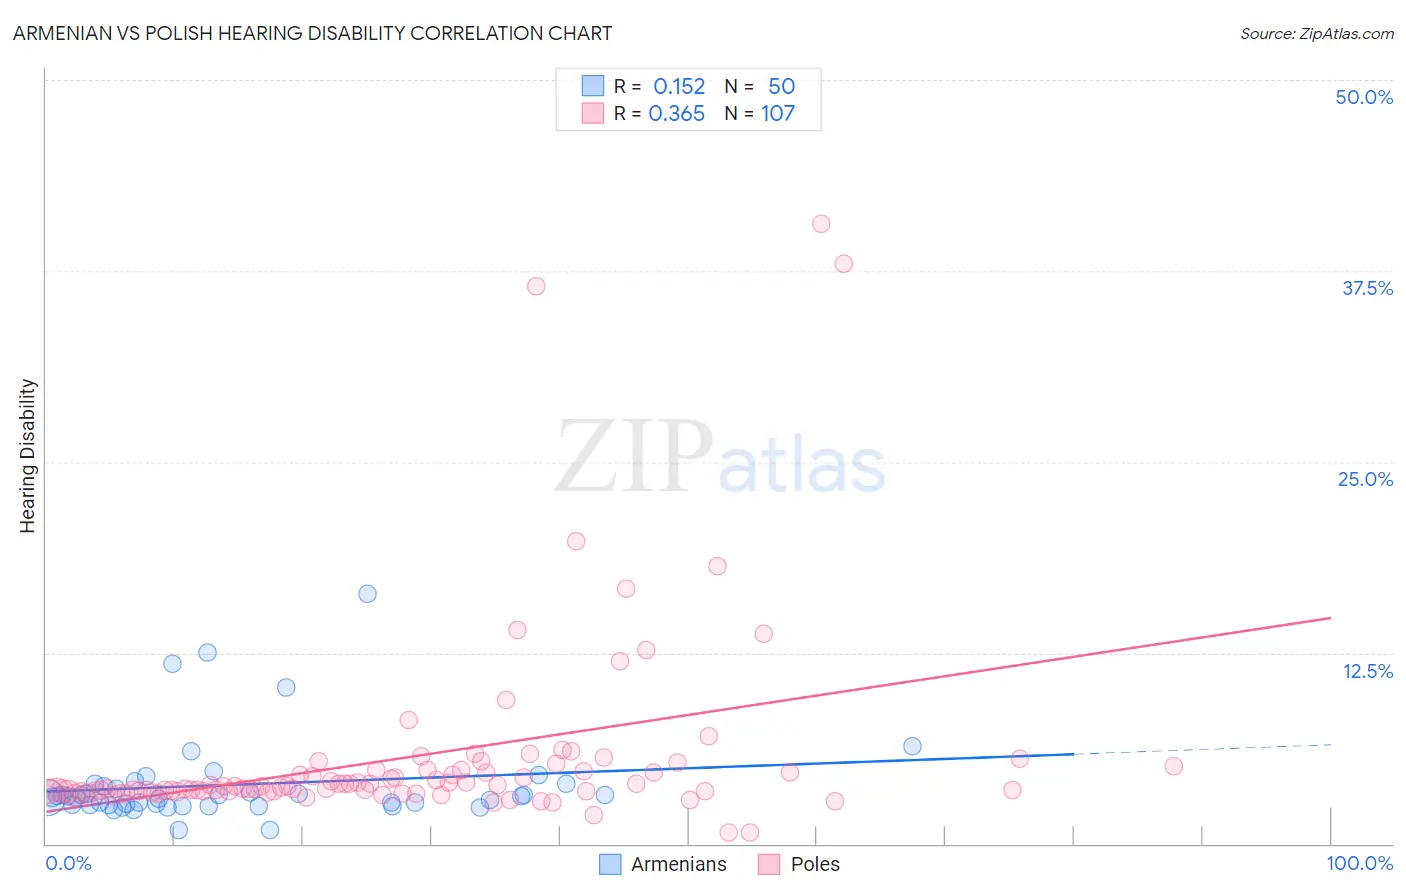
Armenian vs Polish Hearing Disability Correlation Chart
The statistical analysis conducted on geographies consisting of 310,889,694 people shows a poor positive correlation between the proportion of Armenians and percentage of population with hearing disability in the United States with a correlation coefficient (R) of 0.152 and weighted average of 3.0%. Similarly, the statistical analysis conducted on geographies consisting of 559,927,295 people shows a mild positive correlation between the proportion of Poles and percentage of population with hearing disability in the United States with a correlation coefficient (R) of 0.365 and weighted average of 3.4%, a difference of 15.1%.
Hearing Disability Correlation Summary
| Measurement | Armenian | Polish |
| Minimum | 0.86% | 0.74% |
| Maximum | 16.4% | 40.6% |
| Range | 15.5% | 39.8% |
| Mean | 3.9% | 5.7% |
| Median | 3.1% | 3.7% |
| Interquartile 25% (IQ1) | 2.6% | 3.4% |
| Interquartile 75% (IQ3) | 3.8% | 4.8% |
| Interquartile Range (IQR) | 1.2% | 1.4% |
| Standard Deviation (Sample) | 2.9% | 6.4% |
| Standard Deviation (Population) | 2.9% | 6.4% |
Similar Demographics by Hearing Disability
Demographics Similar to Armenians by Hearing Disability
In terms of hearing disability, the demographic groups most similar to Armenians are Immigrants from Ukraine (3.0%, a difference of 0.060%), Immigrants from Cabo Verde (3.0%, a difference of 0.090%), Arab (3.0%, a difference of 0.15%), Immigrants from Greece (3.0%, a difference of 0.18%), and Immigrants from Eastern Europe (3.0%, a difference of 0.20%).
| Demographics | Rating | Rank | Hearing Disability |
| Immigrants | Zimbabwe | 64.2 /100 | #165 | Good 3.0% |
| Immigrants | South Eastern Asia | 62.9 /100 | #166 | Good 3.0% |
| Immigrants | Eastern Europe | 58.1 /100 | #167 | Average 3.0% |
| Immigrants | Greece | 57.9 /100 | #168 | Average 3.0% |
| Arabs | 57.6 /100 | #169 | Average 3.0% |
| Immigrants | Cabo Verde | 56.9 /100 | #170 | Average 3.0% |
| Immigrants | Ukraine | 56.6 /100 | #171 | Average 3.0% |
| Armenians | 56.0 /100 | #172 | Average 3.0% |
| Immigrants | Serbia | 51.1 /100 | #173 | Average 3.0% |
| Indonesians | 50.0 /100 | #174 | Average 3.0% |
| Immigrants | Romania | 48.4 /100 | #175 | Average 3.0% |
| Panamanians | 47.0 /100 | #176 | Average 3.0% |
| Immigrants | Philippines | 46.4 /100 | #177 | Average 3.0% |
| Japanese | 46.0 /100 | #178 | Average 3.0% |
| Immigrants | Moldova | 43.1 /100 | #179 | Average 3.0% |
Demographics Similar to Poles by Hearing Disability
In terms of hearing disability, the demographic groups most similar to Poles are Hmong (3.4%, a difference of 0.040%), Slavic (3.4%, a difference of 0.23%), Yaqui (3.4%, a difference of 0.49%), Northern European (3.4%, a difference of 0.56%), and Carpatho Rusyn (3.4%, a difference of 0.65%).
| Demographics | Rating | Rank | Hearing Disability |
| Austrians | 0.6 /100 | #248 | Tragic 3.4% |
| Italians | 0.4 /100 | #249 | Tragic 3.4% |
| Yuman | 0.4 /100 | #250 | Tragic 3.4% |
| Hungarians | 0.4 /100 | #251 | Tragic 3.4% |
| Croatians | 0.4 /100 | #252 | Tragic 3.4% |
| Carpatho Rusyns | 0.3 /100 | #253 | Tragic 3.4% |
| Slavs | 0.2 /100 | #254 | Tragic 3.4% |
| Poles | 0.2 /100 | #255 | Tragic 3.4% |
| Hmong | 0.2 /100 | #256 | Tragic 3.4% |
| Yaqui | 0.2 /100 | #257 | Tragic 3.4% |
| Northern Europeans | 0.2 /100 | #258 | Tragic 3.4% |
| Slovenes | 0.1 /100 | #259 | Tragic 3.5% |
| Portuguese | 0.1 /100 | #260 | Tragic 3.5% |
| Hawaiians | 0.1 /100 | #261 | Tragic 3.5% |
| Immigrants | North America | 0.1 /100 | #262 | Tragic 3.5% |