Seminole vs Polish Hearing Disability
COMPARE
Seminole
Polish
Hearing Disability
Hearing Disability Comparison
Seminole
Poles
4.1%
HEARING DISABILITY
0.0/ 100
METRIC RATING
322nd/ 347
METRIC RANK
3.4%
HEARING DISABILITY
0.2/ 100
METRIC RATING
255th/ 347
METRIC RANK
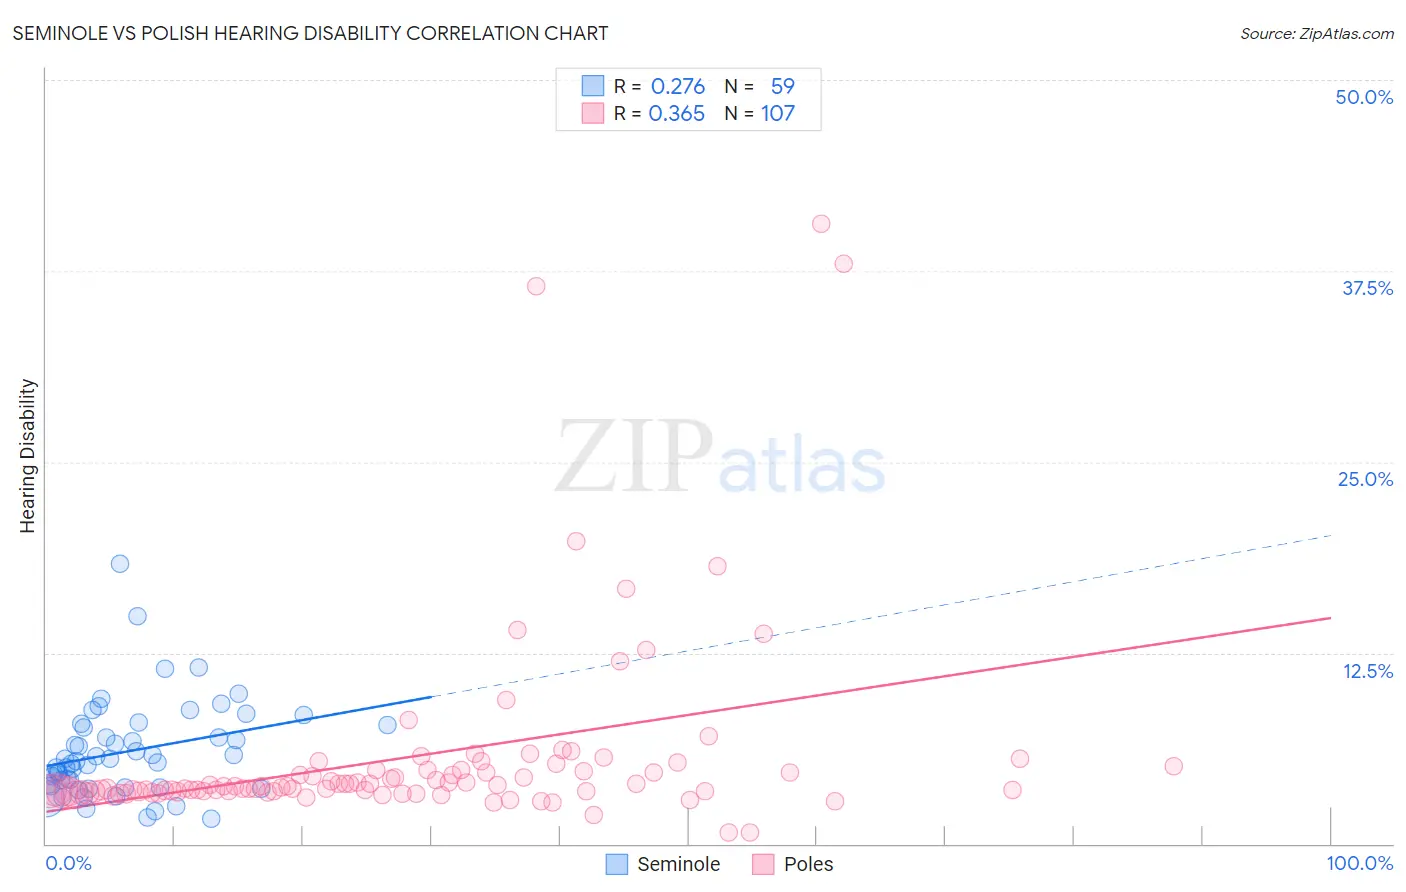
Seminole vs Polish Hearing Disability Correlation Chart
The statistical analysis conducted on geographies consisting of 118,281,320 people shows a weak positive correlation between the proportion of Seminole and percentage of population with hearing disability in the United States with a correlation coefficient (R) of 0.276 and weighted average of 4.1%. Similarly, the statistical analysis conducted on geographies consisting of 559,927,295 people shows a mild positive correlation between the proportion of Poles and percentage of population with hearing disability in the United States with a correlation coefficient (R) of 0.365 and weighted average of 3.4%, a difference of 19.2%.
Hearing Disability Correlation Summary
| Measurement | Seminole | Polish |
| Minimum | 1.7% | 0.74% |
| Maximum | 18.4% | 40.6% |
| Range | 16.7% | 39.8% |
| Mean | 6.0% | 5.7% |
| Median | 5.4% | 3.7% |
| Interquartile 25% (IQ1) | 3.8% | 3.4% |
| Interquartile 75% (IQ3) | 7.8% | 4.8% |
| Interquartile Range (IQR) | 4.0% | 1.4% |
| Standard Deviation (Sample) | 3.1% | 6.4% |
| Standard Deviation (Population) | 3.1% | 6.4% |
Similar Demographics by Hearing Disability
Demographics Similar to Seminole by Hearing Disability
In terms of hearing disability, the demographic groups most similar to Seminole are Apache (4.1%, a difference of 0.12%), Osage (4.1%, a difference of 0.19%), Paiute (4.1%, a difference of 0.26%), Lumbee (4.1%, a difference of 0.51%), and Potawatomi (4.1%, a difference of 0.80%).
| Demographics | Rating | Rank | Hearing Disability |
| Puget Sound Salish | 0.0 /100 | #315 | Tragic 3.9% |
| Spanish Americans | 0.0 /100 | #316 | Tragic 4.0% |
| Comanche | 0.0 /100 | #317 | Tragic 4.0% |
| Cheyenne | 0.0 /100 | #318 | Tragic 4.0% |
| Chippewa | 0.0 /100 | #319 | Tragic 4.0% |
| Shoshone | 0.0 /100 | #320 | Tragic 4.0% |
| Paiute | 0.0 /100 | #321 | Tragic 4.1% |
| Seminole | 0.0 /100 | #322 | Tragic 4.1% |
| Apache | 0.0 /100 | #323 | Tragic 4.1% |
| Osage | 0.0 /100 | #324 | Tragic 4.1% |
| Lumbee | 0.0 /100 | #325 | Tragic 4.1% |
| Potawatomi | 0.0 /100 | #326 | Tragic 4.1% |
| Arapaho | 0.0 /100 | #327 | Tragic 4.1% |
| Tohono O'odham | 0.0 /100 | #328 | Tragic 4.2% |
| Crow | 0.0 /100 | #329 | Tragic 4.2% |
Demographics Similar to Poles by Hearing Disability
In terms of hearing disability, the demographic groups most similar to Poles are Hmong (3.4%, a difference of 0.040%), Slavic (3.4%, a difference of 0.23%), Yaqui (3.4%, a difference of 0.49%), Northern European (3.4%, a difference of 0.56%), and Carpatho Rusyn (3.4%, a difference of 0.65%).
| Demographics | Rating | Rank | Hearing Disability |
| Austrians | 0.6 /100 | #248 | Tragic 3.4% |
| Italians | 0.4 /100 | #249 | Tragic 3.4% |
| Yuman | 0.4 /100 | #250 | Tragic 3.4% |
| Hungarians | 0.4 /100 | #251 | Tragic 3.4% |
| Croatians | 0.4 /100 | #252 | Tragic 3.4% |
| Carpatho Rusyns | 0.3 /100 | #253 | Tragic 3.4% |
| Slavs | 0.2 /100 | #254 | Tragic 3.4% |
| Poles | 0.2 /100 | #255 | Tragic 3.4% |
| Hmong | 0.2 /100 | #256 | Tragic 3.4% |
| Yaqui | 0.2 /100 | #257 | Tragic 3.4% |
| Northern Europeans | 0.2 /100 | #258 | Tragic 3.4% |
| Slovenes | 0.1 /100 | #259 | Tragic 3.5% |
| Portuguese | 0.1 /100 | #260 | Tragic 3.5% |
| Hawaiians | 0.1 /100 | #261 | Tragic 3.5% |
| Immigrants | North America | 0.1 /100 | #262 | Tragic 3.5% |