Samoan vs Immigrants from Grenada Disability Age 65 to 74
COMPARE
Samoan
Immigrants from Grenada
Disability Age 65 to 74
Disability Age 65 to 74 Comparison
Samoans
Immigrants from Grenada
25.4%
DISABILITY AGE 65 TO 74
0.2/ 100
METRIC RATING
262nd/ 347
METRIC RANK
23.8%
DISABILITY AGE 65 TO 74
22.1/ 100
METRIC RATING
204th/ 347
METRIC RANK
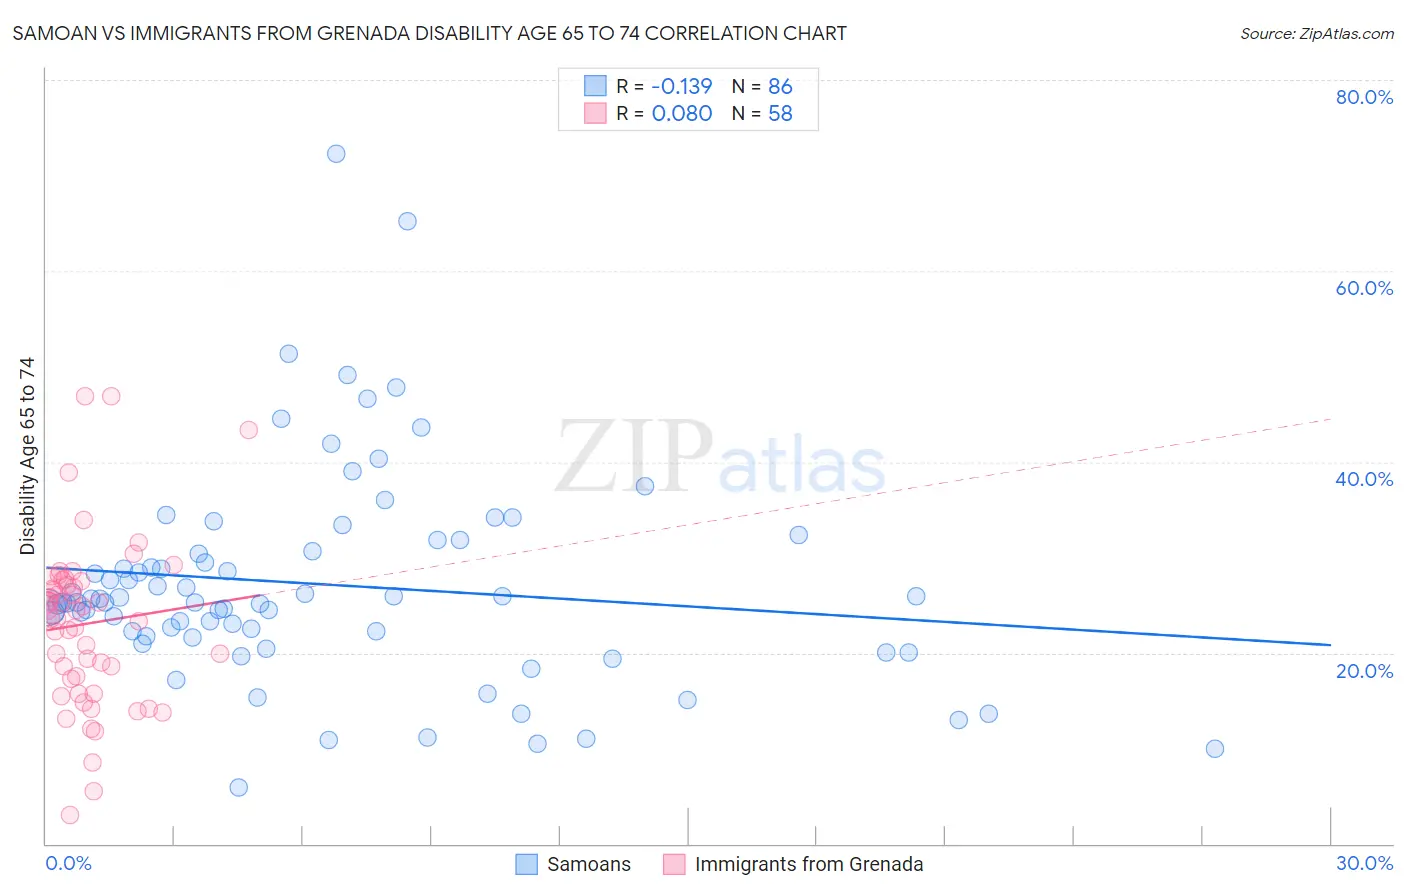
Samoan vs Immigrants from Grenada Disability Age 65 to 74 Correlation Chart
The statistical analysis conducted on geographies consisting of 224,691,566 people shows a poor negative correlation between the proportion of Samoans and percentage of population with a disability between the ages 65 and 75 in the United States with a correlation coefficient (R) of -0.139 and weighted average of 25.4%. Similarly, the statistical analysis conducted on geographies consisting of 67,159,466 people shows a slight positive correlation between the proportion of Immigrants from Grenada and percentage of population with a disability between the ages 65 and 75 in the United States with a correlation coefficient (R) of 0.080 and weighted average of 23.8%, a difference of 7.1%.
Disability Age 65 to 74 Correlation Summary
| Measurement | Samoan | Immigrants from Grenada |
| Minimum | 5.9% | 3.0% |
| Maximum | 72.2% | 46.9% |
| Range | 66.4% | 43.9% |
| Mean | 27.2% | 23.1% |
| Median | 25.3% | 24.0% |
| Interquartile 25% (IQ1) | 21.8% | 17.2% |
| Interquartile 75% (IQ3) | 30.7% | 27.5% |
| Interquartile Range (IQR) | 8.9% | 10.2% |
| Standard Deviation (Sample) | 11.1% | 8.7% |
| Standard Deviation (Population) | 11.1% | 8.7% |
Similar Demographics by Disability Age 65 to 74
Demographics Similar to Samoans by Disability Age 65 to 74
In terms of disability age 65 to 74, the demographic groups most similar to Samoans are Iroquois (25.4%, a difference of 0.010%), Cape Verdean (25.4%, a difference of 0.10%), Malaysian (25.4%, a difference of 0.18%), Hawaiian (25.5%, a difference of 0.35%), and Guatemalan (25.5%, a difference of 0.40%).
| Demographics | Rating | Rank | Disability Age 65 to 74 |
| Central Americans | 0.5 /100 | #255 | Tragic 25.1% |
| Immigrants | Somalia | 0.4 /100 | #256 | Tragic 25.2% |
| Guamanians/Chamorros | 0.3 /100 | #257 | Tragic 25.3% |
| Marshallese | 0.3 /100 | #258 | Tragic 25.3% |
| Immigrants | Cambodia | 0.3 /100 | #259 | Tragic 25.3% |
| Malaysians | 0.2 /100 | #260 | Tragic 25.4% |
| Cape Verdeans | 0.2 /100 | #261 | Tragic 25.4% |
| Samoans | 0.2 /100 | #262 | Tragic 25.4% |
| Iroquois | 0.2 /100 | #263 | Tragic 25.4% |
| Hawaiians | 0.2 /100 | #264 | Tragic 25.5% |
| Guatemalans | 0.2 /100 | #265 | Tragic 25.5% |
| Immigrants | Latin America | 0.1 /100 | #266 | Tragic 25.6% |
| Ottawa | 0.1 /100 | #267 | Tragic 25.6% |
| Liberians | 0.1 /100 | #268 | Tragic 25.6% |
| Hmong | 0.1 /100 | #269 | Tragic 25.7% |
Demographics Similar to Immigrants from Grenada by Disability Age 65 to 74
In terms of disability age 65 to 74, the demographic groups most similar to Immigrants from Grenada are Kenyan (23.7%, a difference of 0.090%), Immigrants from Bahamas (23.7%, a difference of 0.11%), Tongan (23.8%, a difference of 0.11%), Immigrants from Jamaica (23.8%, a difference of 0.11%), and French Canadian (23.7%, a difference of 0.15%).
| Demographics | Rating | Rank | Disability Age 65 to 74 |
| Immigrants | Immigrants | 25.8 /100 | #197 | Fair 23.7% |
| Immigrants | Africa | 24.4 /100 | #198 | Fair 23.7% |
| Welsh | 24.3 /100 | #199 | Fair 23.7% |
| French Canadians | 24.0 /100 | #200 | Fair 23.7% |
| Immigrants | Ecuador | 23.9 /100 | #201 | Fair 23.7% |
| Immigrants | Bahamas | 23.3 /100 | #202 | Fair 23.7% |
| Kenyans | 23.2 /100 | #203 | Fair 23.7% |
| Immigrants | Grenada | 22.1 /100 | #204 | Fair 23.8% |
| Tongans | 20.8 /100 | #205 | Fair 23.8% |
| Immigrants | Jamaica | 20.7 /100 | #206 | Fair 23.8% |
| Immigrants | Sudan | 20.1 /100 | #207 | Fair 23.8% |
| Immigrants | Barbados | 19.6 /100 | #208 | Poor 23.8% |
| Immigrants | Kenya | 19.6 /100 | #209 | Poor 23.8% |
| Trinidadians and Tobagonians | 16.4 /100 | #210 | Poor 23.9% |
| Immigrants | West Indies | 15.9 /100 | #211 | Poor 23.9% |