Samoan vs Swiss Disability Age 65 to 74
COMPARE
Samoan
Swiss
Disability Age 65 to 74
Disability Age 65 to 74 Comparison
Samoans
Swiss
25.4%
DISABILITY AGE 65 TO 74
0.2/ 100
METRIC RATING
262nd/ 347
METRIC RANK
22.9%
DISABILITY AGE 65 TO 74
79.7/ 100
METRIC RATING
149th/ 347
METRIC RANK
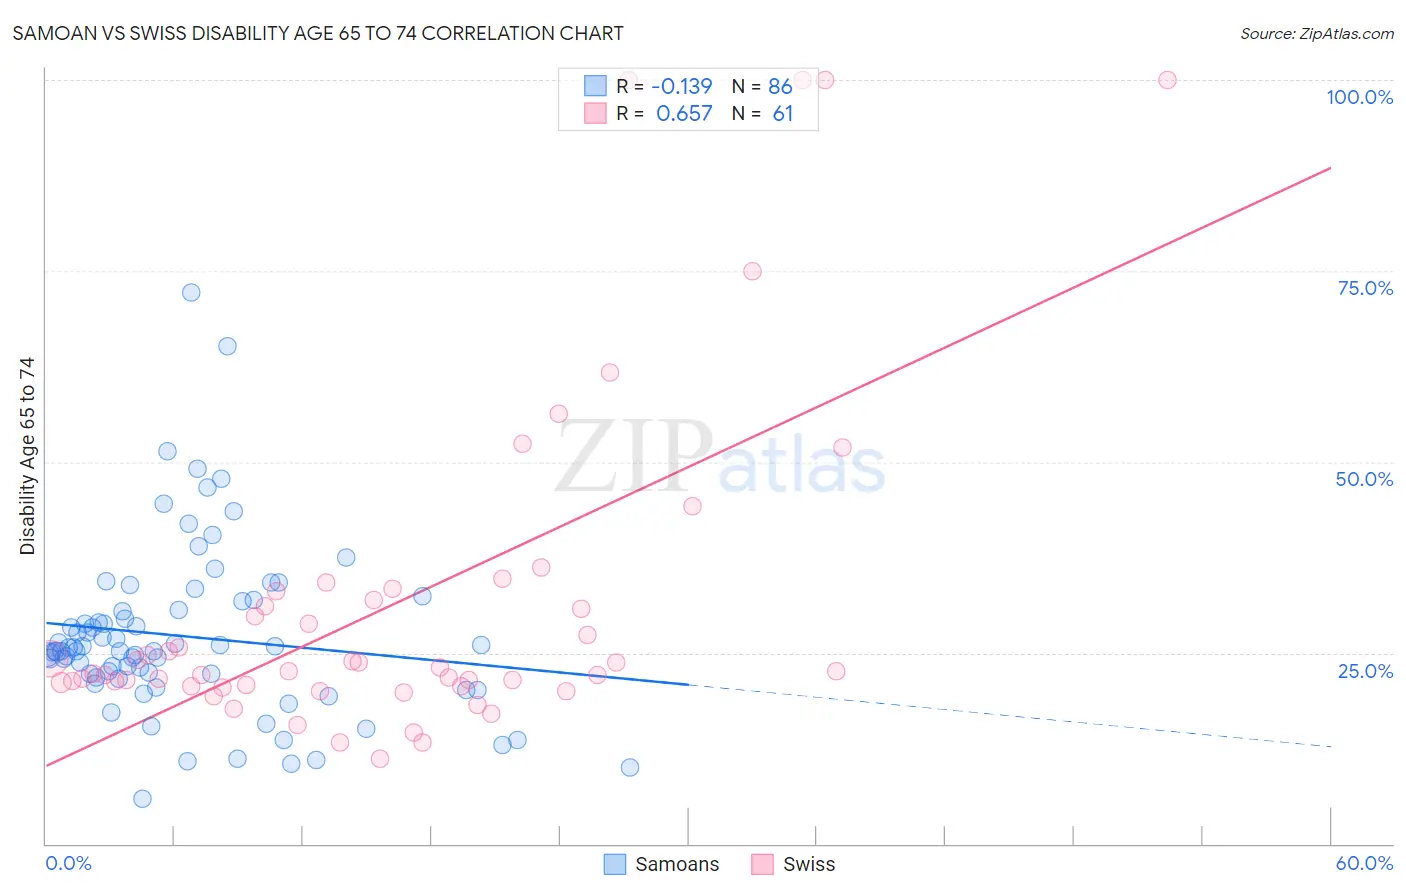
Samoan vs Swiss Disability Age 65 to 74 Correlation Chart
The statistical analysis conducted on geographies consisting of 224,691,566 people shows a poor negative correlation between the proportion of Samoans and percentage of population with a disability between the ages 65 and 75 in the United States with a correlation coefficient (R) of -0.139 and weighted average of 25.4%. Similarly, the statistical analysis conducted on geographies consisting of 464,066,686 people shows a significant positive correlation between the proportion of Swiss and percentage of population with a disability between the ages 65 and 75 in the United States with a correlation coefficient (R) of 0.657 and weighted average of 22.9%, a difference of 11.2%.
Disability Age 65 to 74 Correlation Summary
| Measurement | Samoan | Swiss |
| Minimum | 5.9% | 11.1% |
| Maximum | 72.2% | 100.0% |
| Range | 66.4% | 88.9% |
| Mean | 27.2% | 31.5% |
| Median | 25.3% | 22.6% |
| Interquartile 25% (IQ1) | 21.8% | 20.7% |
| Interquartile 75% (IQ3) | 30.7% | 32.5% |
| Interquartile Range (IQR) | 8.9% | 11.8% |
| Standard Deviation (Sample) | 11.1% | 21.8% |
| Standard Deviation (Population) | 11.1% | 21.6% |
Similar Demographics by Disability Age 65 to 74
Demographics Similar to Samoans by Disability Age 65 to 74
In terms of disability age 65 to 74, the demographic groups most similar to Samoans are Iroquois (25.4%, a difference of 0.010%), Cape Verdean (25.4%, a difference of 0.10%), Malaysian (25.4%, a difference of 0.18%), Hawaiian (25.5%, a difference of 0.35%), and Guatemalan (25.5%, a difference of 0.40%).
| Demographics | Rating | Rank | Disability Age 65 to 74 |
| Central Americans | 0.5 /100 | #255 | Tragic 25.1% |
| Immigrants | Somalia | 0.4 /100 | #256 | Tragic 25.2% |
| Guamanians/Chamorros | 0.3 /100 | #257 | Tragic 25.3% |
| Marshallese | 0.3 /100 | #258 | Tragic 25.3% |
| Immigrants | Cambodia | 0.3 /100 | #259 | Tragic 25.3% |
| Malaysians | 0.2 /100 | #260 | Tragic 25.4% |
| Cape Verdeans | 0.2 /100 | #261 | Tragic 25.4% |
| Samoans | 0.2 /100 | #262 | Tragic 25.4% |
| Iroquois | 0.2 /100 | #263 | Tragic 25.4% |
| Hawaiians | 0.2 /100 | #264 | Tragic 25.5% |
| Guatemalans | 0.2 /100 | #265 | Tragic 25.5% |
| Immigrants | Latin America | 0.1 /100 | #266 | Tragic 25.6% |
| Ottawa | 0.1 /100 | #267 | Tragic 25.6% |
| Liberians | 0.1 /100 | #268 | Tragic 25.6% |
| Hmong | 0.1 /100 | #269 | Tragic 25.7% |
Demographics Similar to Swiss by Disability Age 65 to 74
In terms of disability age 65 to 74, the demographic groups most similar to Swiss are New Zealander (22.9%, a difference of 0.020%), Canadian (22.9%, a difference of 0.18%), Immigrants from Morocco (22.9%, a difference of 0.18%), Finnish (22.9%, a difference of 0.27%), and Immigrants from Uzbekistan (22.8%, a difference of 0.34%).
| Demographics | Rating | Rank | Disability Age 65 to 74 |
| Immigrants | Ethiopia | 85.3 /100 | #142 | Excellent 22.7% |
| Arabs | 84.8 /100 | #143 | Excellent 22.8% |
| Danes | 84.4 /100 | #144 | Excellent 22.8% |
| Immigrants | Uganda | 84.0 /100 | #145 | Excellent 22.8% |
| Alsatians | 83.7 /100 | #146 | Excellent 22.8% |
| Immigrants | Uzbekistan | 83.1 /100 | #147 | Excellent 22.8% |
| New Zealanders | 79.9 /100 | #148 | Good 22.9% |
| Swiss | 79.7 /100 | #149 | Good 22.9% |
| Canadians | 77.7 /100 | #150 | Good 22.9% |
| Immigrants | Morocco | 77.6 /100 | #151 | Good 22.9% |
| Finns | 76.5 /100 | #152 | Good 22.9% |
| Slavs | 75.2 /100 | #153 | Good 23.0% |
| Sri Lankans | 74.0 /100 | #154 | Good 23.0% |
| British | 73.9 /100 | #155 | Good 23.0% |
| Immigrants | Western Asia | 73.8 /100 | #156 | Good 23.0% |