Samoan vs Immigrants from Denmark Disability Age 65 to 74
COMPARE
Samoan
Immigrants from Denmark
Disability Age 65 to 74
Disability Age 65 to 74 Comparison
Samoans
Immigrants from Denmark
25.4%
DISABILITY AGE 65 TO 74
0.2/ 100
METRIC RATING
262nd/ 347
METRIC RANK
21.5%
DISABILITY AGE 65 TO 74
99.5/ 100
METRIC RATING
56th/ 347
METRIC RANK
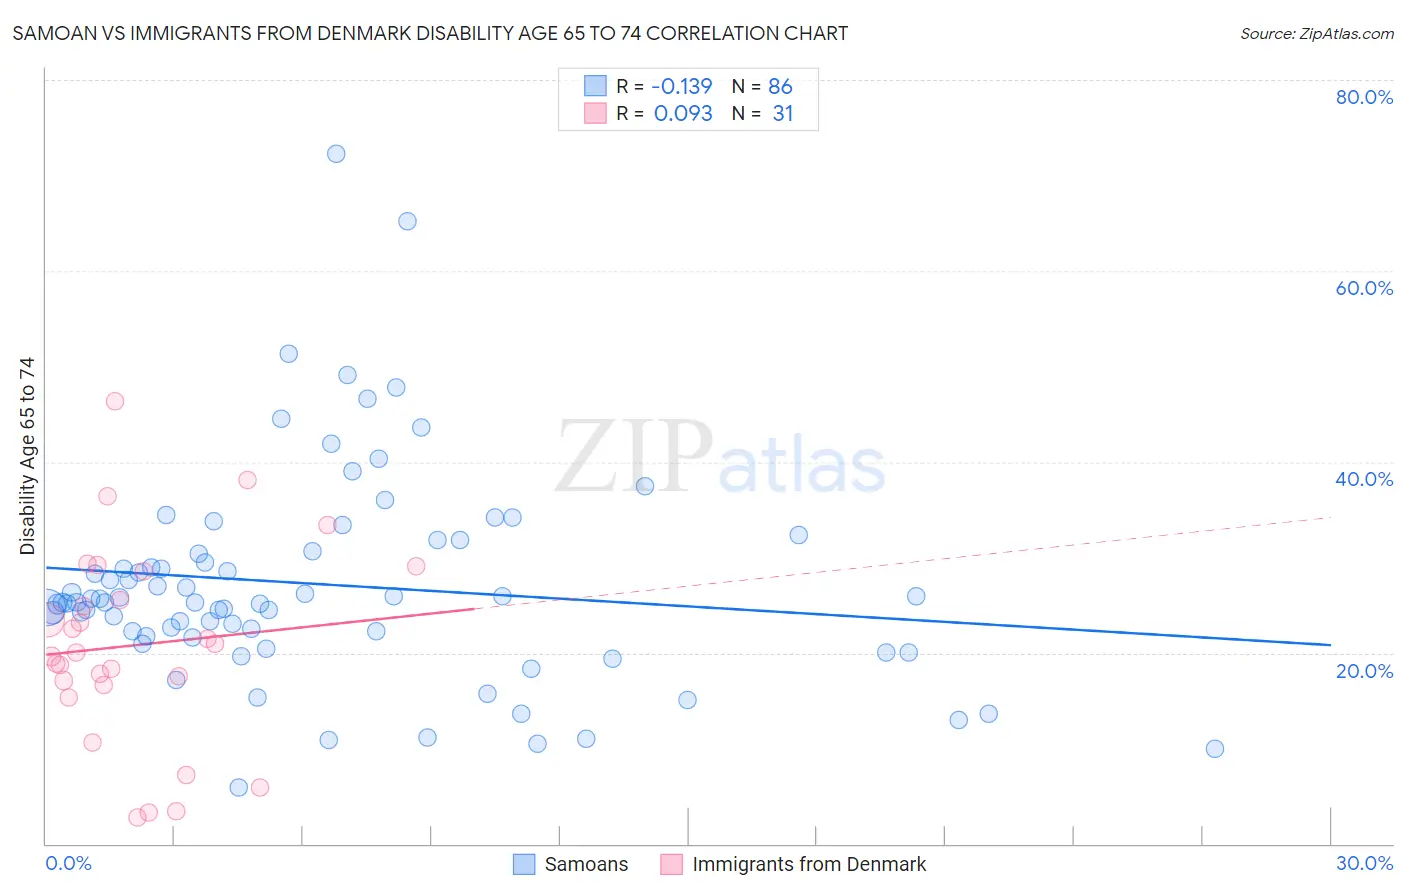
Samoan vs Immigrants from Denmark Disability Age 65 to 74 Correlation Chart
The statistical analysis conducted on geographies consisting of 224,691,566 people shows a poor negative correlation between the proportion of Samoans and percentage of population with a disability between the ages 65 and 75 in the United States with a correlation coefficient (R) of -0.139 and weighted average of 25.4%. Similarly, the statistical analysis conducted on geographies consisting of 136,388,278 people shows a slight positive correlation between the proportion of Immigrants from Denmark and percentage of population with a disability between the ages 65 and 75 in the United States with a correlation coefficient (R) of 0.093 and weighted average of 21.5%, a difference of 18.3%.
Disability Age 65 to 74 Correlation Summary
| Measurement | Samoan | Immigrants from Denmark |
| Minimum | 5.9% | 2.7% |
| Maximum | 72.2% | 46.4% |
| Range | 66.4% | 43.7% |
| Mean | 27.2% | 20.8% |
| Median | 25.3% | 20.0% |
| Interquartile 25% (IQ1) | 21.8% | 16.7% |
| Interquartile 75% (IQ3) | 30.7% | 28.6% |
| Interquartile Range (IQR) | 8.9% | 11.9% |
| Standard Deviation (Sample) | 11.1% | 10.4% |
| Standard Deviation (Population) | 11.1% | 10.2% |
Similar Demographics by Disability Age 65 to 74
Demographics Similar to Samoans by Disability Age 65 to 74
In terms of disability age 65 to 74, the demographic groups most similar to Samoans are Iroquois (25.4%, a difference of 0.010%), Cape Verdean (25.4%, a difference of 0.10%), Malaysian (25.4%, a difference of 0.18%), Hawaiian (25.5%, a difference of 0.35%), and Guatemalan (25.5%, a difference of 0.40%).
| Demographics | Rating | Rank | Disability Age 65 to 74 |
| Central Americans | 0.5 /100 | #255 | Tragic 25.1% |
| Immigrants | Somalia | 0.4 /100 | #256 | Tragic 25.2% |
| Guamanians/Chamorros | 0.3 /100 | #257 | Tragic 25.3% |
| Marshallese | 0.3 /100 | #258 | Tragic 25.3% |
| Immigrants | Cambodia | 0.3 /100 | #259 | Tragic 25.3% |
| Malaysians | 0.2 /100 | #260 | Tragic 25.4% |
| Cape Verdeans | 0.2 /100 | #261 | Tragic 25.4% |
| Samoans | 0.2 /100 | #262 | Tragic 25.4% |
| Iroquois | 0.2 /100 | #263 | Tragic 25.4% |
| Hawaiians | 0.2 /100 | #264 | Tragic 25.5% |
| Guatemalans | 0.2 /100 | #265 | Tragic 25.5% |
| Immigrants | Latin America | 0.1 /100 | #266 | Tragic 25.6% |
| Ottawa | 0.1 /100 | #267 | Tragic 25.6% |
| Liberians | 0.1 /100 | #268 | Tragic 25.6% |
| Hmong | 0.1 /100 | #269 | Tragic 25.7% |
Demographics Similar to Immigrants from Denmark by Disability Age 65 to 74
In terms of disability age 65 to 74, the demographic groups most similar to Immigrants from Denmark are Immigrants from Romania (21.5%, a difference of 0.020%), Immigrants from Italy (21.5%, a difference of 0.10%), Immigrants from Asia (21.5%, a difference of 0.10%), Immigrants from France (21.5%, a difference of 0.11%), and Bhutanese (21.5%, a difference of 0.11%).
| Demographics | Rating | Rank | Disability Age 65 to 74 |
| Luxembourgers | 99.7 /100 | #49 | Exceptional 21.4% |
| Immigrants | Malaysia | 99.7 /100 | #50 | Exceptional 21.4% |
| Immigrants | Serbia | 99.6 /100 | #51 | Exceptional 21.4% |
| Immigrants | France | 99.6 /100 | #52 | Exceptional 21.5% |
| Bhutanese | 99.6 /100 | #53 | Exceptional 21.5% |
| Immigrants | Italy | 99.6 /100 | #54 | Exceptional 21.5% |
| Immigrants | Romania | 99.5 /100 | #55 | Exceptional 21.5% |
| Immigrants | Denmark | 99.5 /100 | #56 | Exceptional 21.5% |
| Immigrants | Asia | 99.5 /100 | #57 | Exceptional 21.5% |
| Immigrants | Pakistan | 99.5 /100 | #58 | Exceptional 21.5% |
| Zimbabweans | 99.5 /100 | #59 | Exceptional 21.5% |
| Immigrants | North Macedonia | 99.5 /100 | #60 | Exceptional 21.6% |
| Egyptians | 99.5 /100 | #61 | Exceptional 21.6% |
| Carpatho Rusyns | 99.5 /100 | #62 | Exceptional 21.6% |
| Immigrants | Europe | 99.4 /100 | #63 | Exceptional 21.6% |