Russian vs English Disability Age 5 to 17
COMPARE
Russian
English
Disability Age 5 to 17
Disability Age 5 to 17 Comparison
Russians
English
5.3%
DISABILITY AGE 5 TO 17
98.2/ 100
METRIC RATING
107th/ 347
METRIC RANK
6.2%
DISABILITY AGE 5 TO 17
0.0/ 100
METRIC RATING
285th/ 347
METRIC RANK
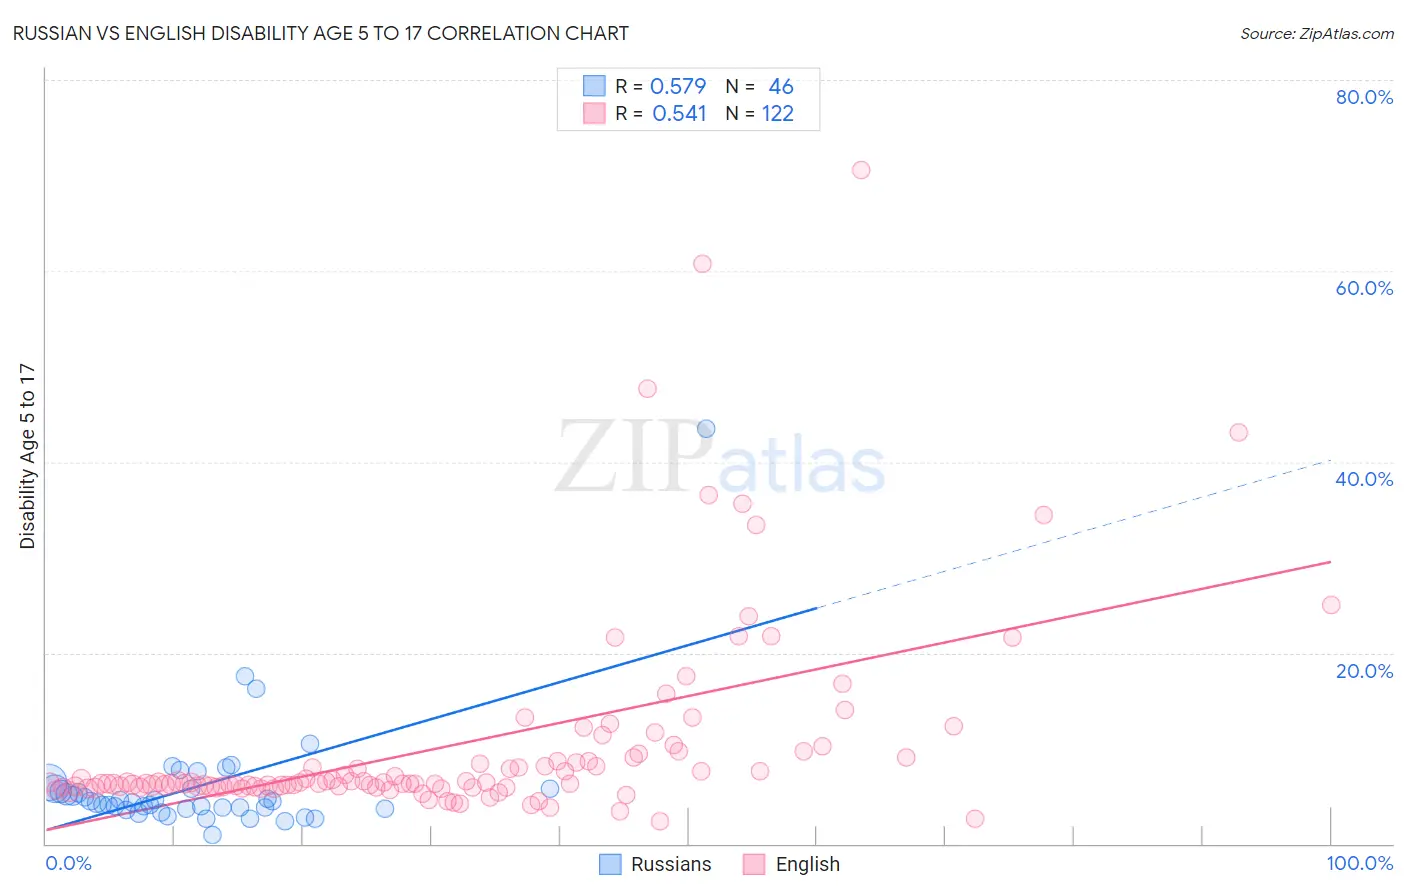
Russian vs English Disability Age 5 to 17 Correlation Chart
The statistical analysis conducted on geographies consisting of 503,780,510 people shows a substantial positive correlation between the proportion of Russians and percentage of population with a disability between the ages 5 and 17 in the United States with a correlation coefficient (R) of 0.579 and weighted average of 5.3%. Similarly, the statistical analysis conducted on geographies consisting of 563,308,437 people shows a substantial positive correlation between the proportion of English and percentage of population with a disability between the ages 5 and 17 in the United States with a correlation coefficient (R) of 0.541 and weighted average of 6.2%, a difference of 15.7%.
Disability Age 5 to 17 Correlation Summary
| Measurement | Russian | English |
| Minimum | 0.98% | 2.4% |
| Maximum | 43.5% | 70.5% |
| Range | 42.5% | 68.2% |
| Mean | 6.0% | 10.4% |
| Median | 4.4% | 6.4% |
| Interquartile 25% (IQ1) | 3.6% | 6.0% |
| Interquartile 75% (IQ3) | 5.7% | 9.1% |
| Interquartile Range (IQR) | 2.1% | 3.1% |
| Standard Deviation (Sample) | 6.4% | 10.7% |
| Standard Deviation (Population) | 6.4% | 10.7% |
Similar Demographics by Disability Age 5 to 17
Demographics Similar to Russians by Disability Age 5 to 17
In terms of disability age 5 to 17, the demographic groups most similar to Russians are Immigrants from Yemen (5.3%, a difference of 0.030%), Immigrants from South Africa (5.3%, a difference of 0.040%), Immigrants from Northern Africa (5.3%, a difference of 0.080%), Immigrants from Eritrea (5.3%, a difference of 0.12%), and Immigrants from Italy (5.3%, a difference of 0.16%).
| Demographics | Rating | Rank | Disability Age 5 to 17 |
| Nepalese | 98.7 /100 | #100 | Exceptional 5.3% |
| Menominee | 98.7 /100 | #101 | Exceptional 5.3% |
| Nicaraguans | 98.6 /100 | #102 | Exceptional 5.3% |
| Salvadorans | 98.6 /100 | #103 | Exceptional 5.3% |
| Peruvians | 98.5 /100 | #104 | Exceptional 5.3% |
| Immigrants | Italy | 98.4 /100 | #105 | Exceptional 5.3% |
| Immigrants | Yemen | 98.2 /100 | #106 | Exceptional 5.3% |
| Russians | 98.2 /100 | #107 | Exceptional 5.3% |
| Immigrants | South Africa | 98.1 /100 | #108 | Exceptional 5.3% |
| Immigrants | Northern Africa | 98.1 /100 | #109 | Exceptional 5.3% |
| Immigrants | Eritrea | 98.0 /100 | #110 | Exceptional 5.3% |
| Ethiopians | 97.9 /100 | #111 | Exceptional 5.3% |
| Immigrants | Latvia | 97.9 /100 | #112 | Exceptional 5.3% |
| Aleuts | 97.8 /100 | #113 | Exceptional 5.3% |
| Immigrants | Northern Europe | 97.8 /100 | #114 | Exceptional 5.3% |
Demographics Similar to English by Disability Age 5 to 17
In terms of disability age 5 to 17, the demographic groups most similar to English are Subsaharan African (6.2%, a difference of 0.0%), Ugandan (6.2%, a difference of 0.030%), Colville (6.2%, a difference of 0.040%), German (6.1%, a difference of 0.19%), and Pima (6.2%, a difference of 0.23%).
| Demographics | Rating | Rank | Disability Age 5 to 17 |
| Immigrants | Liberia | 0.1 /100 | #278 | Tragic 6.1% |
| Immigrants | Jamaica | 0.1 /100 | #279 | Tragic 6.1% |
| Portuguese | 0.1 /100 | #280 | Tragic 6.1% |
| Scottish | 0.0 /100 | #281 | Tragic 6.1% |
| Germans | 0.0 /100 | #282 | Tragic 6.1% |
| Ugandans | 0.0 /100 | #283 | Tragic 6.2% |
| Sub-Saharan Africans | 0.0 /100 | #284 | Tragic 6.2% |
| English | 0.0 /100 | #285 | Tragic 6.2% |
| Colville | 0.0 /100 | #286 | Tragic 6.2% |
| Pima | 0.0 /100 | #287 | Tragic 6.2% |
| Jamaicans | 0.0 /100 | #288 | Tragic 6.2% |
| Yaqui | 0.0 /100 | #289 | Tragic 6.2% |
| Immigrants | Congo | 0.0 /100 | #290 | Tragic 6.2% |
| Whites/Caucasians | 0.0 /100 | #291 | Tragic 6.2% |
| Immigrants | Senegal | 0.0 /100 | #292 | Tragic 6.2% |