Pueblo vs White/Caucasian Disability Age Over 75
COMPARE
Pueblo
White/Caucasian
Disability Age Over 75
Disability Age Over 75 Comparison
Pueblo
Whites/Caucasians
55.9%
DISABILITY AGE OVER 75
0.0/ 100
METRIC RATING
340th/ 347
METRIC RANK
47.3%
DISABILITY AGE OVER 75
50.0/ 100
METRIC RATING
174th/ 347
METRIC RANK
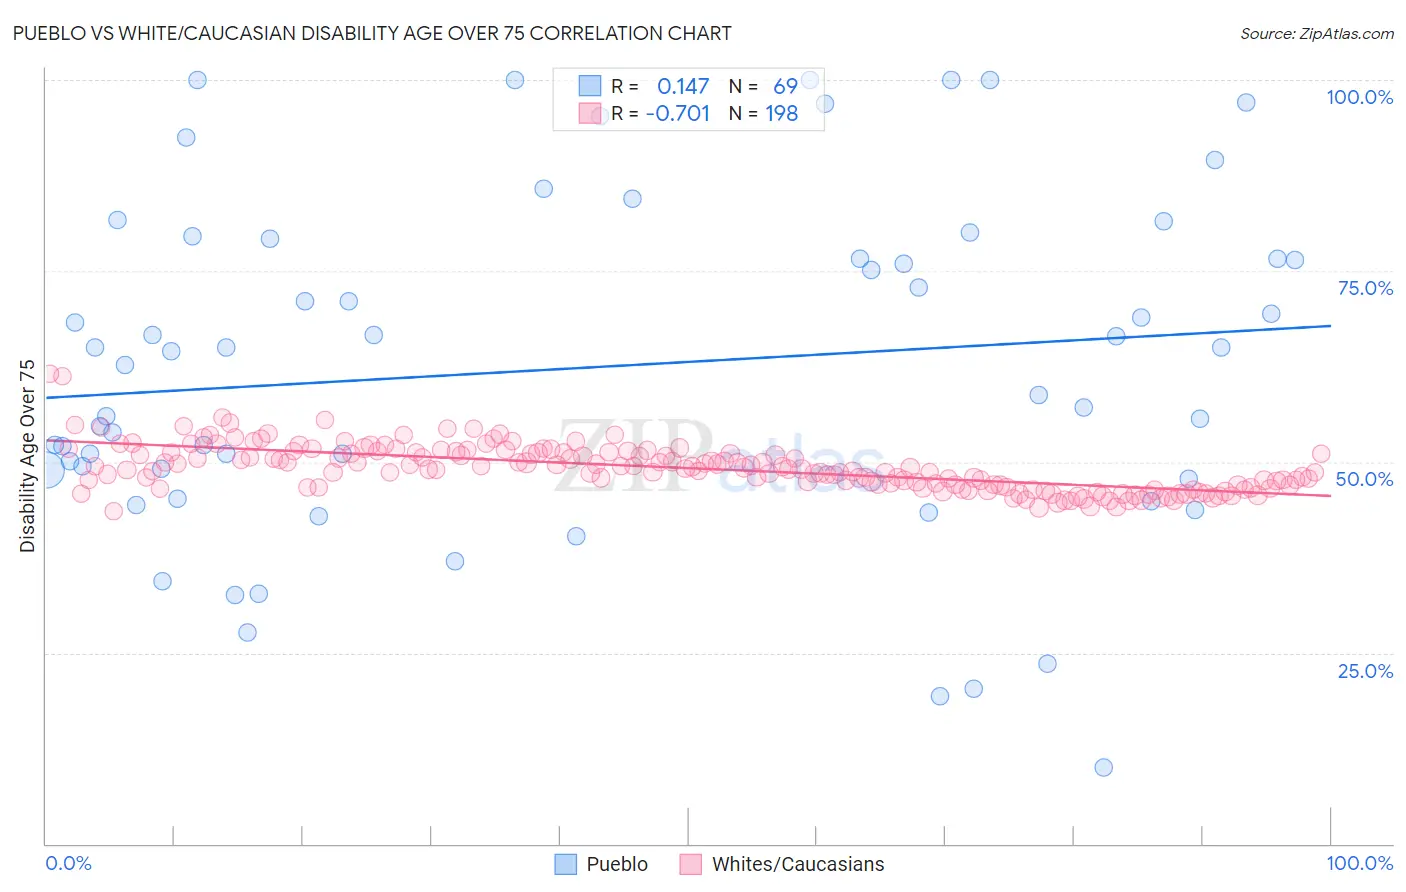
Pueblo vs White/Caucasian Disability Age Over 75 Correlation Chart
The statistical analysis conducted on geographies consisting of 119,996,484 people shows a poor positive correlation between the proportion of Pueblo and percentage of population with a disability over the age of 75 in the United States with a correlation coefficient (R) of 0.147 and weighted average of 55.9%. Similarly, the statistical analysis conducted on geographies consisting of 580,540,031 people shows a strong negative correlation between the proportion of Whites/Caucasians and percentage of population with a disability over the age of 75 in the United States with a correlation coefficient (R) of -0.701 and weighted average of 47.3%, a difference of 18.0%.
Disability Age Over 75 Correlation Summary
| Measurement | Pueblo | White/Caucasian |
| Minimum | 10.0% | 43.5% |
| Maximum | 100.0% | 61.5% |
| Range | 90.0% | 18.0% |
| Mean | 62.3% | 49.2% |
| Median | 64.5% | 49.0% |
| Interquartile 25% (IQ1) | 48.4% | 46.7% |
| Interquartile 75% (IQ3) | 77.9% | 51.2% |
| Interquartile Range (IQR) | 29.5% | 4.5% |
| Standard Deviation (Sample) | 22.0% | 3.0% |
| Standard Deviation (Population) | 21.8% | 3.0% |
Similar Demographics by Disability Age Over 75
Demographics Similar to Pueblo by Disability Age Over 75
In terms of disability age over 75, the demographic groups most similar to Pueblo are Pima (55.8%, a difference of 0.080%), Houma (56.2%, a difference of 0.51%), Lumbee (56.2%, a difference of 0.67%), Colville (55.4%, a difference of 0.90%), and Tohono O'odham (56.7%, a difference of 1.5%).
| Demographics | Rating | Rank | Disability Age Over 75 |
| Apache | 0.0 /100 | #333 | Tragic 53.6% |
| Alaskan Athabascans | 0.0 /100 | #334 | Tragic 54.0% |
| Kiowa | 0.0 /100 | #335 | Tragic 54.2% |
| Immigrants | Armenia | 0.0 /100 | #336 | Tragic 54.3% |
| Yuman | 0.0 /100 | #337 | Tragic 54.4% |
| Colville | 0.0 /100 | #338 | Tragic 55.4% |
| Pima | 0.0 /100 | #339 | Tragic 55.8% |
| Pueblo | 0.0 /100 | #340 | Tragic 55.9% |
| Houma | 0.0 /100 | #341 | Tragic 56.2% |
| Lumbee | 0.0 /100 | #342 | Tragic 56.2% |
| Tohono O'odham | 0.0 /100 | #343 | Tragic 56.7% |
| Navajo | 0.0 /100 | #344 | Tragic 58.3% |
| Inupiat | 0.0 /100 | #345 | Tragic 58.4% |
| Tsimshian | 0.0 /100 | #346 | Tragic 59.2% |
| Yup'ik | 0.0 /100 | #347 | Tragic 61.1% |
Demographics Similar to Whites/Caucasians by Disability Age Over 75
In terms of disability age over 75, the demographic groups most similar to Whites/Caucasians are Immigrants from Haiti (47.3%, a difference of 0.010%), Alsatian (47.3%, a difference of 0.040%), Scotch-Irish (47.3%, a difference of 0.060%), Ecuadorian (47.4%, a difference of 0.070%), and Immigrants from Africa (47.3%, a difference of 0.080%).
| Demographics | Rating | Rank | Disability Age Over 75 |
| Moroccans | 62.9 /100 | #167 | Good 47.2% |
| Kenyans | 58.8 /100 | #168 | Average 47.2% |
| Celtics | 58.7 /100 | #169 | Average 47.2% |
| German Russians | 56.2 /100 | #170 | Average 47.3% |
| Immigrants | Africa | 53.6 /100 | #171 | Average 47.3% |
| Scotch-Irish | 52.5 /100 | #172 | Average 47.3% |
| Alsatians | 51.9 /100 | #173 | Average 47.3% |
| Whites/Caucasians | 50.0 /100 | #174 | Average 47.3% |
| Immigrants | Haiti | 49.7 /100 | #175 | Average 47.3% |
| Ecuadorians | 46.7 /100 | #176 | Average 47.4% |
| Haitians | 44.6 /100 | #177 | Average 47.4% |
| Cubans | 42.1 /100 | #178 | Average 47.4% |
| Sierra Leoneans | 41.7 /100 | #179 | Average 47.4% |
| Immigrants | Ecuador | 41.7 /100 | #180 | Average 47.4% |
| Immigrants | Kazakhstan | 40.4 /100 | #181 | Average 47.4% |