Moroccan vs White/Caucasian Disability Age Over 75
COMPARE
Moroccan
White/Caucasian
Disability Age Over 75
Disability Age Over 75 Comparison
Moroccans
Whites/Caucasians
47.2%
DISABILITY AGE OVER 75
62.9/ 100
METRIC RATING
167th/ 347
METRIC RANK
47.3%
DISABILITY AGE OVER 75
50.0/ 100
METRIC RATING
174th/ 347
METRIC RANK
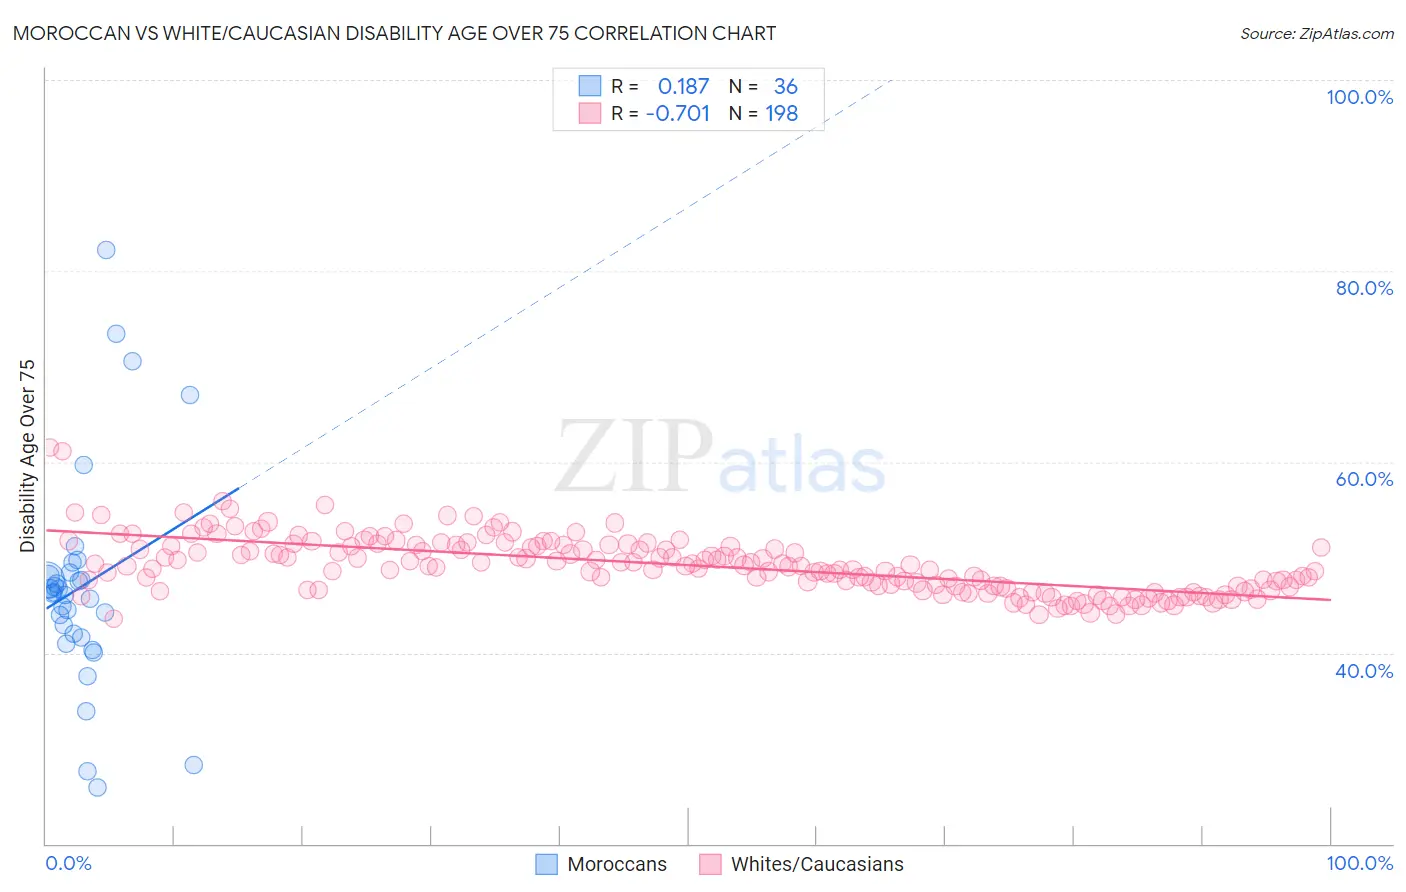
Moroccan vs White/Caucasian Disability Age Over 75 Correlation Chart
The statistical analysis conducted on geographies consisting of 201,702,915 people shows a poor positive correlation between the proportion of Moroccans and percentage of population with a disability over the age of 75 in the United States with a correlation coefficient (R) of 0.187 and weighted average of 47.2%. Similarly, the statistical analysis conducted on geographies consisting of 580,540,031 people shows a strong negative correlation between the proportion of Whites/Caucasians and percentage of population with a disability over the age of 75 in the United States with a correlation coefficient (R) of -0.701 and weighted average of 47.3%, a difference of 0.30%.
Disability Age Over 75 Correlation Summary
| Measurement | Moroccan | White/Caucasian |
| Minimum | 25.9% | 43.5% |
| Maximum | 82.2% | 61.5% |
| Range | 56.4% | 18.0% |
| Mean | 47.0% | 49.2% |
| Median | 46.3% | 49.0% |
| Interquartile 25% (IQ1) | 41.8% | 46.7% |
| Interquartile 75% (IQ3) | 48.2% | 51.2% |
| Interquartile Range (IQR) | 6.4% | 4.5% |
| Standard Deviation (Sample) | 11.7% | 3.0% |
| Standard Deviation (Population) | 11.5% | 3.0% |
Demographics Similar to Moroccans and Whites/Caucasians by Disability Age Over 75
In terms of disability age over 75, the demographic groups most similar to Moroccans are French (47.2%, a difference of 0.040%), Immigrants from Zimbabwe (47.2%, a difference of 0.040%), Immigrants from Sierra Leone (47.2%, a difference of 0.040%), Immigrants from Eastern Africa (47.2%, a difference of 0.070%), and Pennsylvania German (47.2%, a difference of 0.080%). Similarly, the demographic groups most similar to Whites/Caucasians are Immigrants from Haiti (47.3%, a difference of 0.010%), Alsatian (47.3%, a difference of 0.040%), Scotch-Irish (47.3%, a difference of 0.060%), Ecuadorian (47.4%, a difference of 0.070%), and Immigrants from Africa (47.3%, a difference of 0.080%).
| Demographics | Rating | Rank | Disability Age Over 75 |
| Immigrants | Middle Africa | 68.3 /100 | #160 | Good 47.1% |
| South American Indians | 68.1 /100 | #161 | Good 47.1% |
| Pennsylvania Germans | 66.0 /100 | #162 | Good 47.2% |
| Immigrants | Eastern Africa | 65.5 /100 | #163 | Good 47.2% |
| French | 64.6 /100 | #164 | Good 47.2% |
| Immigrants | Zimbabwe | 64.4 /100 | #165 | Good 47.2% |
| Immigrants | Sierra Leone | 64.4 /100 | #166 | Good 47.2% |
| Moroccans | 62.9 /100 | #167 | Good 47.2% |
| Kenyans | 58.8 /100 | #168 | Average 47.2% |
| Celtics | 58.7 /100 | #169 | Average 47.2% |
| German Russians | 56.2 /100 | #170 | Average 47.3% |
| Immigrants | Africa | 53.6 /100 | #171 | Average 47.3% |
| Scotch-Irish | 52.5 /100 | #172 | Average 47.3% |
| Alsatians | 51.9 /100 | #173 | Average 47.3% |
| Whites/Caucasians | 50.0 /100 | #174 | Average 47.3% |
| Immigrants | Haiti | 49.7 /100 | #175 | Average 47.3% |
| Ecuadorians | 46.7 /100 | #176 | Average 47.4% |
| Haitians | 44.6 /100 | #177 | Average 47.4% |
| Cubans | 42.1 /100 | #178 | Average 47.4% |
| Sierra Leoneans | 41.7 /100 | #179 | Average 47.4% |
| Immigrants | Ecuador | 41.7 /100 | #180 | Average 47.4% |