Pueblo vs Menominee Disability Age Over 75
COMPARE
Pueblo
Menominee
Disability Age Over 75
Disability Age Over 75 Comparison
Pueblo
Menominee
55.9%
DISABILITY AGE OVER 75
0.0/ 100
METRIC RATING
340th/ 347
METRIC RANK
52.3%
DISABILITY AGE OVER 75
0.0/ 100
METRIC RATING
324th/ 347
METRIC RANK
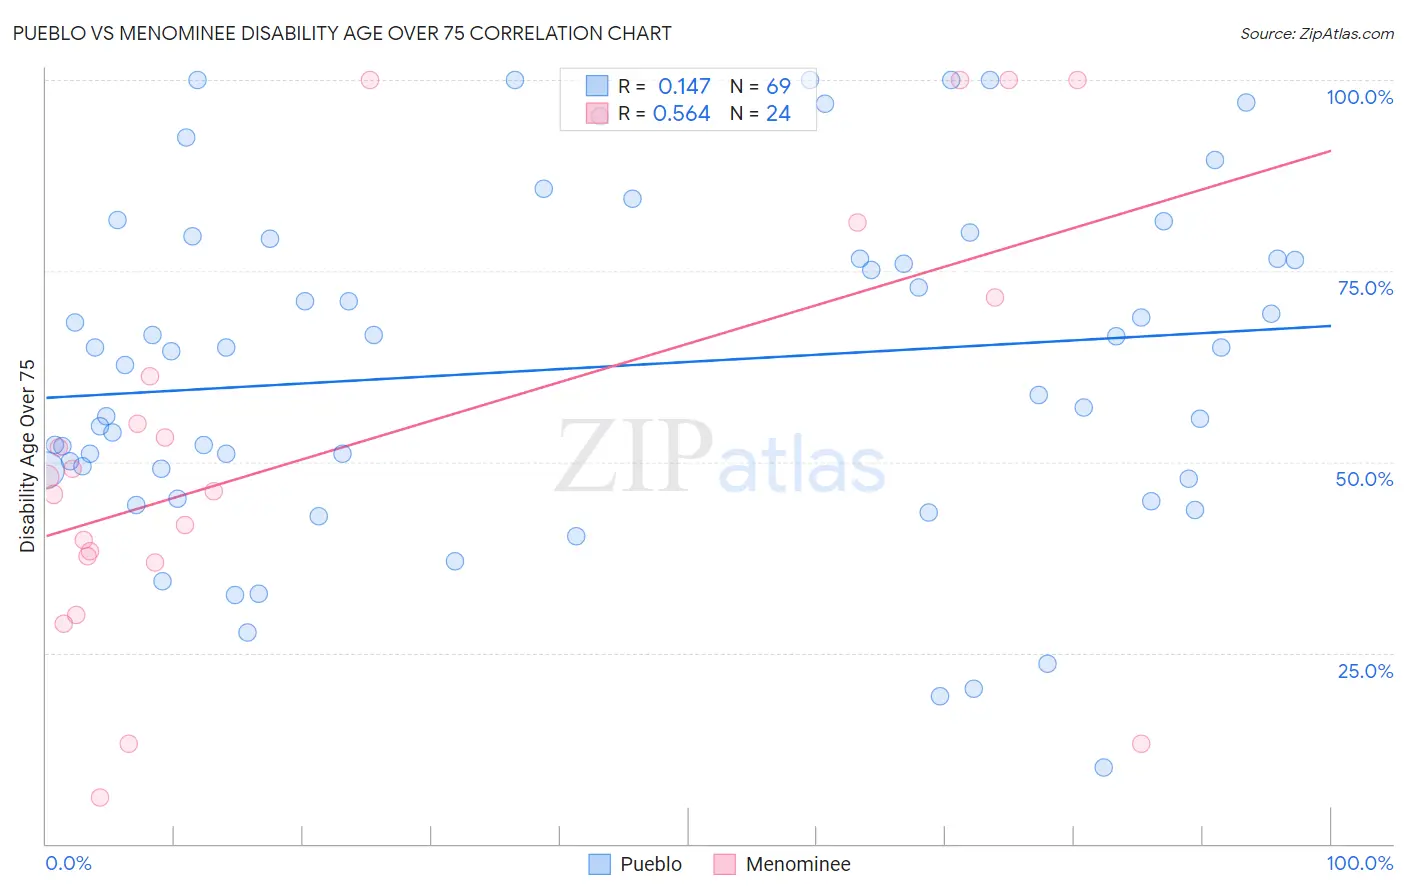
Pueblo vs Menominee Disability Age Over 75 Correlation Chart
The statistical analysis conducted on geographies consisting of 119,996,484 people shows a poor positive correlation between the proportion of Pueblo and percentage of population with a disability over the age of 75 in the United States with a correlation coefficient (R) of 0.147 and weighted average of 55.9%. Similarly, the statistical analysis conducted on geographies consisting of 45,777,346 people shows a substantial positive correlation between the proportion of Menominee and percentage of population with a disability over the age of 75 in the United States with a correlation coefficient (R) of 0.564 and weighted average of 52.3%, a difference of 6.8%.
Disability Age Over 75 Correlation Summary
| Measurement | Pueblo | Menominee |
| Minimum | 10.0% | 6.1% |
| Maximum | 100.0% | 100.0% |
| Range | 90.0% | 93.9% |
| Mean | 62.3% | 52.0% |
| Median | 64.5% | 47.1% |
| Interquartile 25% (IQ1) | 48.4% | 37.2% |
| Interquartile 75% (IQ3) | 77.9% | 66.3% |
| Interquartile Range (IQR) | 29.5% | 29.2% |
| Standard Deviation (Sample) | 22.0% | 27.7% |
| Standard Deviation (Population) | 21.8% | 27.2% |
Demographics Similar to Pueblo and Menominee by Disability Age Over 75
In terms of disability age over 75, the demographic groups most similar to Pueblo are Pima (55.8%, a difference of 0.080%), Houma (56.2%, a difference of 0.51%), Lumbee (56.2%, a difference of 0.67%), Colville (55.4%, a difference of 0.90%), and Yuman (54.4%, a difference of 2.7%). Similarly, the demographic groups most similar to Menominee are Immigrants from Cabo Verde (52.4%, a difference of 0.16%), Ute (52.6%, a difference of 0.51%), Nepalese (52.6%, a difference of 0.54%), Immigrants from Yemen (52.0%, a difference of 0.63%), and Choctaw (52.7%, a difference of 0.73%).
| Demographics | Rating | Rank | Disability Age Over 75 |
| Comanche | 0.0 /100 | #322 | Tragic 51.7% |
| Immigrants | Yemen | 0.0 /100 | #323 | Tragic 52.0% |
| Menominee | 0.0 /100 | #324 | Tragic 52.3% |
| Immigrants | Cabo Verde | 0.0 /100 | #325 | Tragic 52.4% |
| Ute | 0.0 /100 | #326 | Tragic 52.6% |
| Nepalese | 0.0 /100 | #327 | Tragic 52.6% |
| Choctaw | 0.0 /100 | #328 | Tragic 52.7% |
| Alaska Natives | 0.0 /100 | #329 | Tragic 52.8% |
| Puerto Ricans | 0.0 /100 | #330 | Tragic 52.9% |
| Hopi | 0.0 /100 | #331 | Tragic 52.9% |
| Natives/Alaskans | 0.0 /100 | #332 | Tragic 53.1% |
| Apache | 0.0 /100 | #333 | Tragic 53.6% |
| Alaskan Athabascans | 0.0 /100 | #334 | Tragic 54.0% |
| Kiowa | 0.0 /100 | #335 | Tragic 54.2% |
| Immigrants | Armenia | 0.0 /100 | #336 | Tragic 54.3% |
| Yuman | 0.0 /100 | #337 | Tragic 54.4% |
| Colville | 0.0 /100 | #338 | Tragic 55.4% |
| Pima | 0.0 /100 | #339 | Tragic 55.8% |
| Pueblo | 0.0 /100 | #340 | Tragic 55.9% |
| Houma | 0.0 /100 | #341 | Tragic 56.2% |
| Lumbee | 0.0 /100 | #342 | Tragic 56.2% |