Immigrants from South Eastern Asia vs White/Caucasian Disability Age Over 75
COMPARE
Immigrants from South Eastern Asia
White/Caucasian
Disability Age Over 75
Disability Age Over 75 Comparison
Immigrants from South Eastern Asia
Whites/Caucasians
48.7%
DISABILITY AGE OVER 75
0.7/ 100
METRIC RATING
252nd/ 347
METRIC RANK
47.3%
DISABILITY AGE OVER 75
50.0/ 100
METRIC RATING
174th/ 347
METRIC RANK
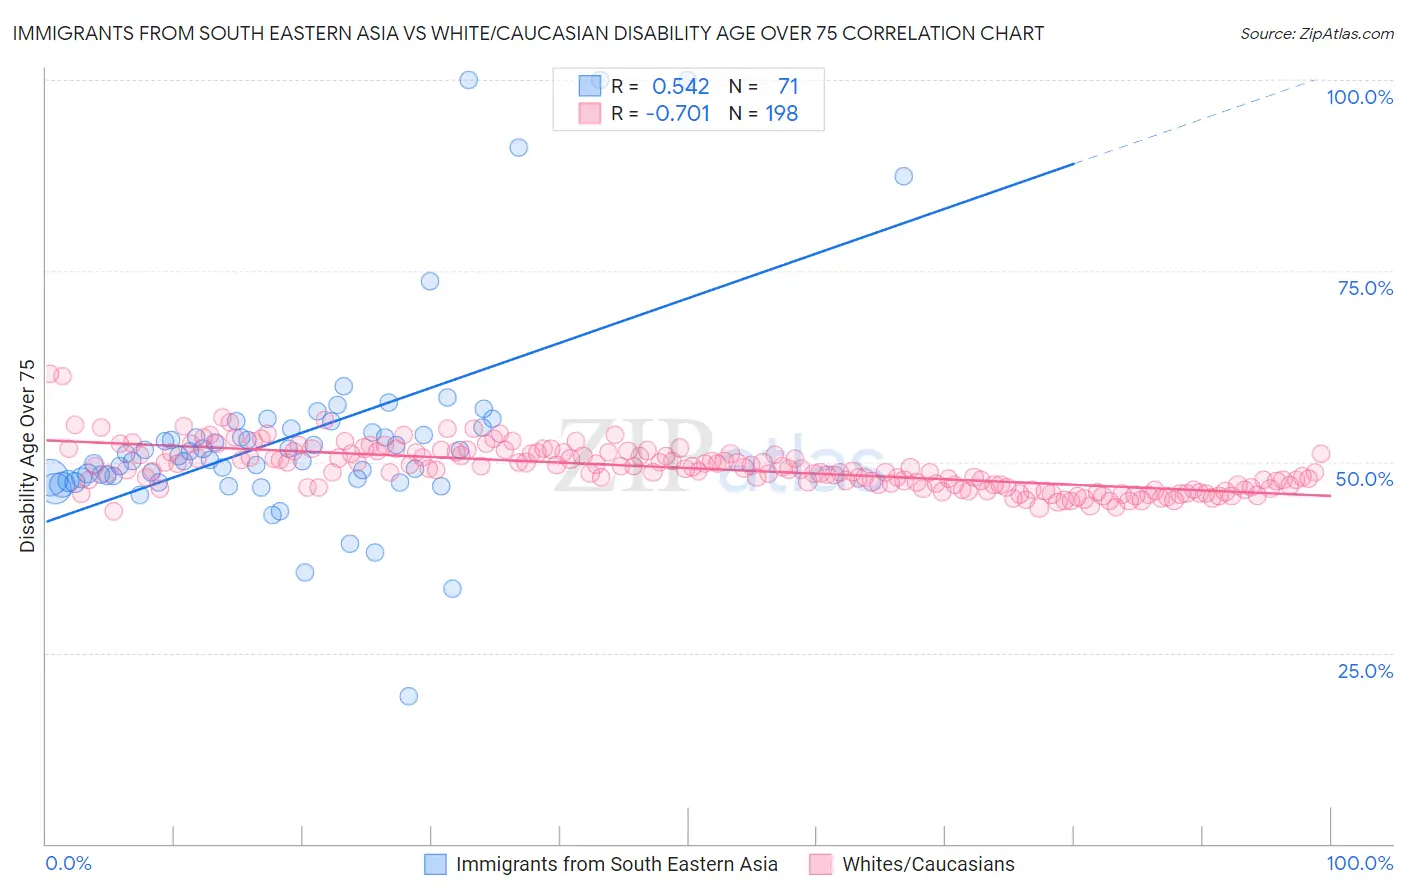
Immigrants from South Eastern Asia vs White/Caucasian Disability Age Over 75 Correlation Chart
The statistical analysis conducted on geographies consisting of 511,260,020 people shows a substantial positive correlation between the proportion of Immigrants from South Eastern Asia and percentage of population with a disability over the age of 75 in the United States with a correlation coefficient (R) of 0.542 and weighted average of 48.7%. Similarly, the statistical analysis conducted on geographies consisting of 580,540,031 people shows a strong negative correlation between the proportion of Whites/Caucasians and percentage of population with a disability over the age of 75 in the United States with a correlation coefficient (R) of -0.701 and weighted average of 47.3%, a difference of 2.8%.
Disability Age Over 75 Correlation Summary
| Measurement | Immigrants from South Eastern Asia | White/Caucasian |
| Minimum | 19.3% | 43.5% |
| Maximum | 100.0% | 61.5% |
| Range | 80.7% | 18.0% |
| Mean | 53.2% | 49.2% |
| Median | 50.8% | 49.0% |
| Interquartile 25% (IQ1) | 47.7% | 46.7% |
| Interquartile 75% (IQ3) | 54.4% | 51.2% |
| Interquartile Range (IQR) | 6.7% | 4.5% |
| Standard Deviation (Sample) | 13.6% | 3.0% |
| Standard Deviation (Population) | 13.5% | 3.0% |
Similar Demographics by Disability Age Over 75
Demographics Similar to Immigrants from South Eastern Asia by Disability Age Over 75
In terms of disability age over 75, the demographic groups most similar to Immigrants from South Eastern Asia are British West Indian (48.7%, a difference of 0.040%), Immigrants from Vietnam (48.7%, a difference of 0.080%), Korean (48.6%, a difference of 0.10%), Chinese (48.7%, a difference of 0.11%), and West Indian (48.6%, a difference of 0.12%).
| Demographics | Rating | Rank | Disability Age Over 75 |
| Americans | 1.7 /100 | #245 | Tragic 48.4% |
| Chippewa | 1.6 /100 | #246 | Tragic 48.4% |
| Iroquois | 1.6 /100 | #247 | Tragic 48.4% |
| Sri Lankans | 1.4 /100 | #248 | Tragic 48.5% |
| Iraqis | 1.0 /100 | #249 | Tragic 48.6% |
| West Indians | 0.8 /100 | #250 | Tragic 48.6% |
| Koreans | 0.8 /100 | #251 | Tragic 48.6% |
| Immigrants | South Eastern Asia | 0.7 /100 | #252 | Tragic 48.7% |
| British West Indians | 0.6 /100 | #253 | Tragic 48.7% |
| Immigrants | Vietnam | 0.6 /100 | #254 | Tragic 48.7% |
| Chinese | 0.5 /100 | #255 | Tragic 48.7% |
| Immigrants | Congo | 0.5 /100 | #256 | Tragic 48.7% |
| Blackfeet | 0.5 /100 | #257 | Tragic 48.8% |
| Immigrants | Philippines | 0.4 /100 | #258 | Tragic 48.8% |
| Central Americans | 0.4 /100 | #259 | Tragic 48.8% |
Demographics Similar to Whites/Caucasians by Disability Age Over 75
In terms of disability age over 75, the demographic groups most similar to Whites/Caucasians are Immigrants from Haiti (47.3%, a difference of 0.010%), Alsatian (47.3%, a difference of 0.040%), Scotch-Irish (47.3%, a difference of 0.060%), Ecuadorian (47.4%, a difference of 0.070%), and Immigrants from Africa (47.3%, a difference of 0.080%).
| Demographics | Rating | Rank | Disability Age Over 75 |
| Moroccans | 62.9 /100 | #167 | Good 47.2% |
| Kenyans | 58.8 /100 | #168 | Average 47.2% |
| Celtics | 58.7 /100 | #169 | Average 47.2% |
| German Russians | 56.2 /100 | #170 | Average 47.3% |
| Immigrants | Africa | 53.6 /100 | #171 | Average 47.3% |
| Scotch-Irish | 52.5 /100 | #172 | Average 47.3% |
| Alsatians | 51.9 /100 | #173 | Average 47.3% |
| Whites/Caucasians | 50.0 /100 | #174 | Average 47.3% |
| Immigrants | Haiti | 49.7 /100 | #175 | Average 47.3% |
| Ecuadorians | 46.7 /100 | #176 | Average 47.4% |
| Haitians | 44.6 /100 | #177 | Average 47.4% |
| Cubans | 42.1 /100 | #178 | Average 47.4% |
| Sierra Leoneans | 41.7 /100 | #179 | Average 47.4% |
| Immigrants | Ecuador | 41.7 /100 | #180 | Average 47.4% |
| Immigrants | Kazakhstan | 40.4 /100 | #181 | Average 47.4% |