Cheyenne vs White/Caucasian Disability Age Over 75
COMPARE
Cheyenne
White/Caucasian
Disability Age Over 75
Disability Age Over 75 Comparison
Cheyenne
Whites/Caucasians
50.9%
DISABILITY AGE OVER 75
0.0/ 100
METRIC RATING
312th/ 347
METRIC RANK
47.3%
DISABILITY AGE OVER 75
50.0/ 100
METRIC RATING
174th/ 347
METRIC RANK
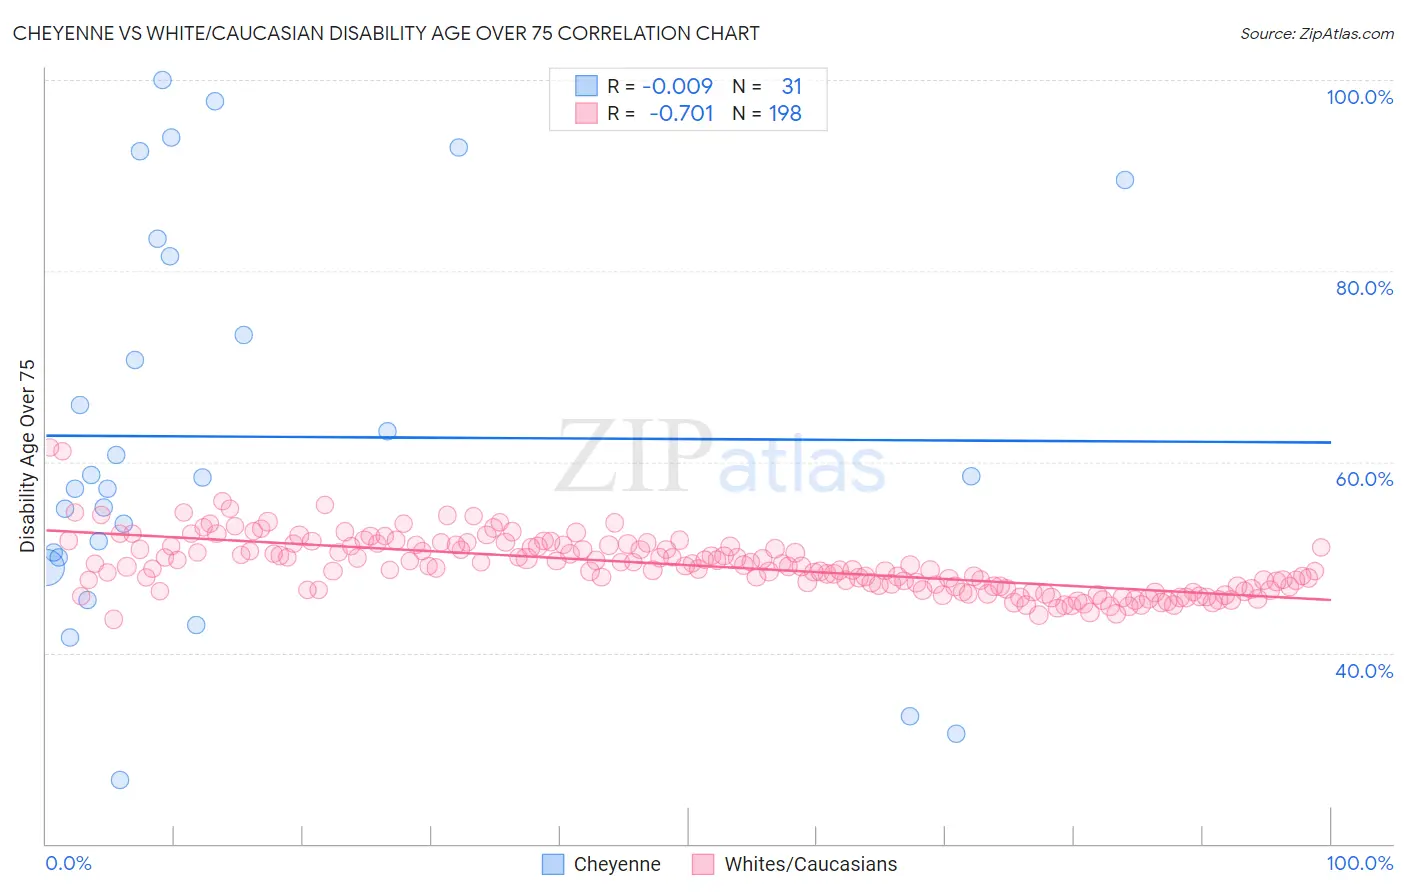
Cheyenne vs White/Caucasian Disability Age Over 75 Correlation Chart
The statistical analysis conducted on geographies consisting of 80,679,697 people shows no correlation between the proportion of Cheyenne and percentage of population with a disability over the age of 75 in the United States with a correlation coefficient (R) of -0.009 and weighted average of 50.9%. Similarly, the statistical analysis conducted on geographies consisting of 580,540,031 people shows a strong negative correlation between the proportion of Whites/Caucasians and percentage of population with a disability over the age of 75 in the United States with a correlation coefficient (R) of -0.701 and weighted average of 47.3%, a difference of 7.5%.
Disability Age Over 75 Correlation Summary
| Measurement | Cheyenne | White/Caucasian |
| Minimum | 26.7% | 43.5% |
| Maximum | 100.0% | 61.5% |
| Range | 73.3% | 18.0% |
| Mean | 62.6% | 49.2% |
| Median | 58.3% | 49.0% |
| Interquartile 25% (IQ1) | 50.0% | 46.7% |
| Interquartile 75% (IQ3) | 81.5% | 51.2% |
| Interquartile Range (IQR) | 31.5% | 4.5% |
| Standard Deviation (Sample) | 20.2% | 3.0% |
| Standard Deviation (Population) | 19.9% | 3.0% |
Similar Demographics by Disability Age Over 75
Demographics Similar to Cheyenne by Disability Age Over 75
In terms of disability age over 75, the demographic groups most similar to Cheyenne are Immigrants from the Azores (50.9%, a difference of 0.050%), Immigrants from Mexico (51.1%, a difference of 0.42%), Cajun (50.7%, a difference of 0.45%), Mexican (51.1%, a difference of 0.47%), and Tlingit-Haida (50.6%, a difference of 0.55%).
| Demographics | Rating | Rank | Disability Age Over 75 |
| Central American Indians | 0.0 /100 | #305 | Tragic 50.5% |
| Immigrants | Central America | 0.0 /100 | #306 | Tragic 50.5% |
| Immigrants | Fiji | 0.0 /100 | #307 | Tragic 50.6% |
| Hispanics or Latinos | 0.0 /100 | #308 | Tragic 50.6% |
| Aleuts | 0.0 /100 | #309 | Tragic 50.6% |
| Tlingit-Haida | 0.0 /100 | #310 | Tragic 50.6% |
| Cajuns | 0.0 /100 | #311 | Tragic 50.7% |
| Cheyenne | 0.0 /100 | #312 | Tragic 50.9% |
| Immigrants | Azores | 0.0 /100 | #313 | Tragic 50.9% |
| Immigrants | Mexico | 0.0 /100 | #314 | Tragic 51.1% |
| Mexicans | 0.0 /100 | #315 | Tragic 51.1% |
| Chickasaw | 0.0 /100 | #316 | Tragic 51.2% |
| Yakama | 0.0 /100 | #317 | Tragic 51.3% |
| Seminole | 0.0 /100 | #318 | Tragic 51.5% |
| Creek | 0.0 /100 | #319 | Tragic 51.5% |
Demographics Similar to Whites/Caucasians by Disability Age Over 75
In terms of disability age over 75, the demographic groups most similar to Whites/Caucasians are Immigrants from Haiti (47.3%, a difference of 0.010%), Alsatian (47.3%, a difference of 0.040%), Scotch-Irish (47.3%, a difference of 0.060%), Ecuadorian (47.4%, a difference of 0.070%), and Immigrants from Africa (47.3%, a difference of 0.080%).
| Demographics | Rating | Rank | Disability Age Over 75 |
| Moroccans | 62.9 /100 | #167 | Good 47.2% |
| Kenyans | 58.8 /100 | #168 | Average 47.2% |
| Celtics | 58.7 /100 | #169 | Average 47.2% |
| German Russians | 56.2 /100 | #170 | Average 47.3% |
| Immigrants | Africa | 53.6 /100 | #171 | Average 47.3% |
| Scotch-Irish | 52.5 /100 | #172 | Average 47.3% |
| Alsatians | 51.9 /100 | #173 | Average 47.3% |
| Whites/Caucasians | 50.0 /100 | #174 | Average 47.3% |
| Immigrants | Haiti | 49.7 /100 | #175 | Average 47.3% |
| Ecuadorians | 46.7 /100 | #176 | Average 47.4% |
| Haitians | 44.6 /100 | #177 | Average 47.4% |
| Cubans | 42.1 /100 | #178 | Average 47.4% |
| Sierra Leoneans | 41.7 /100 | #179 | Average 47.4% |
| Immigrants | Ecuador | 41.7 /100 | #180 | Average 47.4% |
| Immigrants | Kazakhstan | 40.4 /100 | #181 | Average 47.4% |