Mongolian vs White/Caucasian Disability Age Over 75
COMPARE
Mongolian
White/Caucasian
Disability Age Over 75
Disability Age Over 75 Comparison
Mongolians
Whites/Caucasians
46.3%
DISABILITY AGE OVER 75
97.7/ 100
METRIC RATING
101st/ 347
METRIC RANK
47.3%
DISABILITY AGE OVER 75
50.0/ 100
METRIC RATING
174th/ 347
METRIC RANK
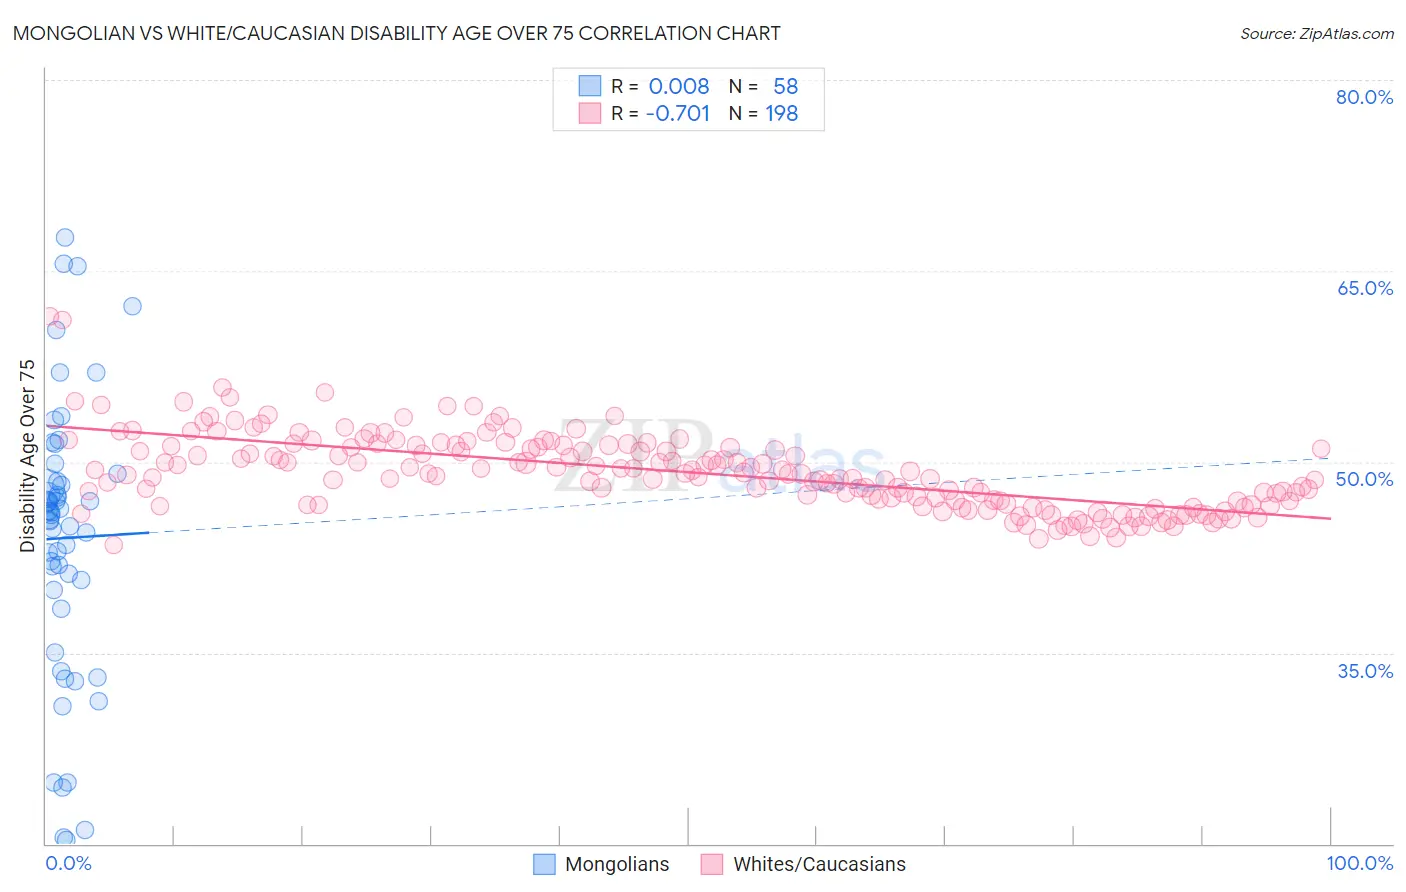
Mongolian vs White/Caucasian Disability Age Over 75 Correlation Chart
The statistical analysis conducted on geographies consisting of 140,199,354 people shows no correlation between the proportion of Mongolians and percentage of population with a disability over the age of 75 in the United States with a correlation coefficient (R) of 0.008 and weighted average of 46.3%. Similarly, the statistical analysis conducted on geographies consisting of 580,540,031 people shows a strong negative correlation between the proportion of Whites/Caucasians and percentage of population with a disability over the age of 75 in the United States with a correlation coefficient (R) of -0.701 and weighted average of 47.3%, a difference of 2.1%.
Disability Age Over 75 Correlation Summary
| Measurement | Mongolian | White/Caucasian |
| Minimum | 20.3% | 43.5% |
| Maximum | 67.6% | 61.5% |
| Range | 47.4% | 18.0% |
| Mean | 44.0% | 49.2% |
| Median | 45.9% | 49.0% |
| Interquartile 25% (IQ1) | 39.9% | 46.7% |
| Interquartile 75% (IQ3) | 48.5% | 51.2% |
| Interquartile Range (IQR) | 8.5% | 4.5% |
| Standard Deviation (Sample) | 10.9% | 3.0% |
| Standard Deviation (Population) | 10.8% | 3.0% |
Similar Demographics by Disability Age Over 75
Demographics Similar to Mongolians by Disability Age Over 75
In terms of disability age over 75, the demographic groups most similar to Mongolians are Palestinian (46.3%, a difference of 0.0%), Immigrants from Eastern Europe (46.3%, a difference of 0.0%), Immigrants from Japan (46.3%, a difference of 0.040%), Finnish (46.3%, a difference of 0.050%), and Immigrants from Brazil (46.3%, a difference of 0.080%).
| Demographics | Rating | Rank | Disability Age Over 75 |
| Albanians | 98.1 /100 | #94 | Exceptional 46.3% |
| Immigrants | Brazil | 98.0 /100 | #95 | Exceptional 46.3% |
| Immigrants | China | 98.0 /100 | #96 | Exceptional 46.3% |
| Finns | 97.9 /100 | #97 | Exceptional 46.3% |
| Immigrants | Japan | 97.8 /100 | #98 | Exceptional 46.3% |
| Palestinians | 97.7 /100 | #99 | Exceptional 46.3% |
| Immigrants | Eastern Europe | 97.7 /100 | #100 | Exceptional 46.3% |
| Mongolians | 97.7 /100 | #101 | Exceptional 46.3% |
| Immigrants | Malaysia | 97.1 /100 | #102 | Exceptional 46.4% |
| Ukrainians | 97.1 /100 | #103 | Exceptional 46.4% |
| Israelis | 97.0 /100 | #104 | Exceptional 46.4% |
| Immigrants | Cameroon | 96.9 /100 | #105 | Exceptional 46.4% |
| Immigrants | Kuwait | 96.8 /100 | #106 | Exceptional 46.4% |
| Immigrants | Uruguay | 96.7 /100 | #107 | Exceptional 46.4% |
| Brazilians | 96.6 /100 | #108 | Exceptional 46.5% |
Demographics Similar to Whites/Caucasians by Disability Age Over 75
In terms of disability age over 75, the demographic groups most similar to Whites/Caucasians are Immigrants from Haiti (47.3%, a difference of 0.010%), Alsatian (47.3%, a difference of 0.040%), Scotch-Irish (47.3%, a difference of 0.060%), Ecuadorian (47.4%, a difference of 0.070%), and Immigrants from Africa (47.3%, a difference of 0.080%).
| Demographics | Rating | Rank | Disability Age Over 75 |
| Moroccans | 62.9 /100 | #167 | Good 47.2% |
| Kenyans | 58.8 /100 | #168 | Average 47.2% |
| Celtics | 58.7 /100 | #169 | Average 47.2% |
| German Russians | 56.2 /100 | #170 | Average 47.3% |
| Immigrants | Africa | 53.6 /100 | #171 | Average 47.3% |
| Scotch-Irish | 52.5 /100 | #172 | Average 47.3% |
| Alsatians | 51.9 /100 | #173 | Average 47.3% |
| Whites/Caucasians | 50.0 /100 | #174 | Average 47.3% |
| Immigrants | Haiti | 49.7 /100 | #175 | Average 47.3% |
| Ecuadorians | 46.7 /100 | #176 | Average 47.4% |
| Haitians | 44.6 /100 | #177 | Average 47.4% |
| Cubans | 42.1 /100 | #178 | Average 47.4% |
| Sierra Leoneans | 41.7 /100 | #179 | Average 47.4% |
| Immigrants | Ecuador | 41.7 /100 | #180 | Average 47.4% |
| Immigrants | Kazakhstan | 40.4 /100 | #181 | Average 47.4% |