Nepalese vs Nonimmigrants Disability Age Under 5
COMPARE
Nepalese
Nonimmigrants
Disability Age Under 5
Disability Age Under 5 Comparison
Nepalese
Nonimmigrants
0.97%
DISABILITY AGE UNDER 5
100.0/ 100
METRIC RATING
20th/ 347
METRIC RANK
1.6%
DISABILITY AGE UNDER 5
0.0/ 100
METRIC RATING
297th/ 347
METRIC RANK
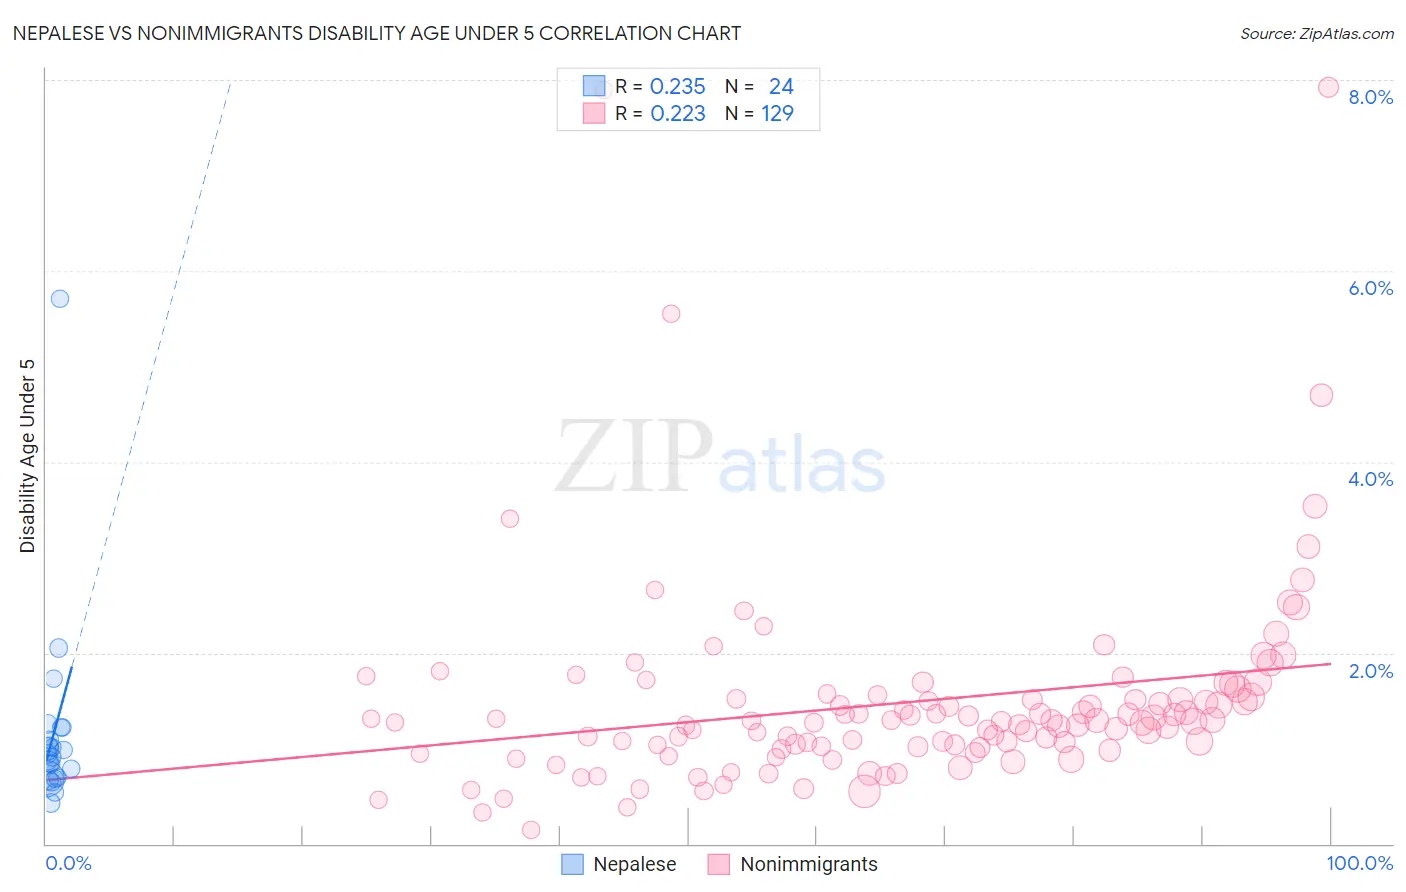
Nepalese vs Nonimmigrants Disability Age Under 5 Correlation Chart
The statistical analysis conducted on geographies consisting of 20,092,908 people shows a weak positive correlation between the proportion of Nepalese and percentage of population with a disability under the age of 5 in the United States with a correlation coefficient (R) of 0.235 and weighted average of 0.97%. Similarly, the statistical analysis conducted on geographies consisting of 262,587,524 people shows a weak positive correlation between the proportion of Nonimmigrants and percentage of population with a disability under the age of 5 in the United States with a correlation coefficient (R) of 0.223 and weighted average of 1.6%, a difference of 65.1%.
Disability Age Under 5 Correlation Summary
| Measurement | Nepalese | Nonimmigrants |
| Minimum | 0.43% | 0.14% |
| Maximum | 5.7% | 7.9% |
| Range | 5.3% | 7.8% |
| Mean | 1.2% | 1.5% |
| Median | 0.93% | 1.3% |
| Interquartile 25% (IQ1) | 0.69% | 1.0% |
| Interquartile 75% (IQ3) | 1.2% | 1.5% |
| Interquartile Range (IQR) | 0.46% | 0.54% |
| Standard Deviation (Sample) | 1.0% | 1.1% |
| Standard Deviation (Population) | 1.0% | 1.1% |
Similar Demographics by Disability Age Under 5
Demographics Similar to Nepalese by Disability Age Under 5
In terms of disability age under 5, the demographic groups most similar to Nepalese are Puget Sound Salish (0.97%, a difference of 0.10%), Immigrants from Barbados (0.97%, a difference of 0.47%), Immigrants from China (0.96%, a difference of 1.1%), Immigrants from Israel (0.96%, a difference of 1.5%), and British West Indian (0.99%, a difference of 1.8%).
| Demographics | Rating | Rank | Disability Age Under 5 |
| Soviet Union | 100.0 /100 | #13 | Exceptional 0.95% |
| Yuman | 100.0 /100 | #14 | Exceptional 0.95% |
| Immigrants | Hong Kong | 100.0 /100 | #15 | Exceptional 0.95% |
| Immigrants | Israel | 100.0 /100 | #16 | Exceptional 0.96% |
| Immigrants | China | 100.0 /100 | #17 | Exceptional 0.96% |
| Immigrants | Barbados | 100.0 /100 | #18 | Exceptional 0.97% |
| Puget Sound Salish | 100.0 /100 | #19 | Exceptional 0.97% |
| Nepalese | 100.0 /100 | #20 | Exceptional 0.97% |
| British West Indians | 100.0 /100 | #21 | Exceptional 0.99% |
| Immigrants | Iran | 100.0 /100 | #22 | Exceptional 1.00% |
| Yakama | 100.0 /100 | #23 | Exceptional 1.00% |
| Indians (Asian) | 100.0 /100 | #24 | Exceptional 1.0% |
| Immigrants | Micronesia | 100.0 /100 | #25 | Exceptional 1.0% |
| Immigrants | Taiwan | 100.0 /100 | #26 | Exceptional 1.0% |
| Guyanese | 100.0 /100 | #27 | Exceptional 1.0% |
Demographics Similar to Nonimmigrants by Disability Age Under 5
In terms of disability age under 5, the demographic groups most similar to Nonimmigrants are Cajun (1.6%, a difference of 0.010%), Portuguese (1.6%, a difference of 0.58%), Shoshone (1.6%, a difference of 0.91%), Polish (1.6%, a difference of 0.96%), and Finnish (1.6%, a difference of 1.0%).
| Demographics | Rating | Rank | Disability Age Under 5 |
| Czechs | 0.0 /100 | #290 | Tragic 1.5% |
| Northern Europeans | 0.0 /100 | #291 | Tragic 1.6% |
| Italians | 0.0 /100 | #292 | Tragic 1.6% |
| Lithuanians | 0.0 /100 | #293 | Tragic 1.6% |
| Swedes | 0.0 /100 | #294 | Tragic 1.6% |
| Finns | 0.0 /100 | #295 | Tragic 1.6% |
| Poles | 0.0 /100 | #296 | Tragic 1.6% |
| Immigrants | Nonimmigrants | 0.0 /100 | #297 | Tragic 1.6% |
| Cajuns | 0.0 /100 | #298 | Tragic 1.6% |
| Portuguese | 0.0 /100 | #299 | Tragic 1.6% |
| Shoshone | 0.0 /100 | #300 | Tragic 1.6% |
| German Russians | 0.0 /100 | #301 | Tragic 1.6% |
| Welsh | 0.0 /100 | #302 | Tragic 1.6% |
| Swiss | 0.0 /100 | #303 | Tragic 1.6% |
| Seminole | 0.0 /100 | #304 | Tragic 1.6% |