Potawatomi vs French American Indian Disability Age 5 to 17
COMPARE
Potawatomi
French American Indian
Disability Age 5 to 17
Disability Age 5 to 17 Comparison
Potawatomi
French American Indians
6.5%
DISABILITY AGE 5 TO 17
0.0/ 100
METRIC RATING
326th/ 347
METRIC RANK
6.6%
DISABILITY AGE 5 TO 17
0.0/ 100
METRIC RATING
327th/ 347
METRIC RANK
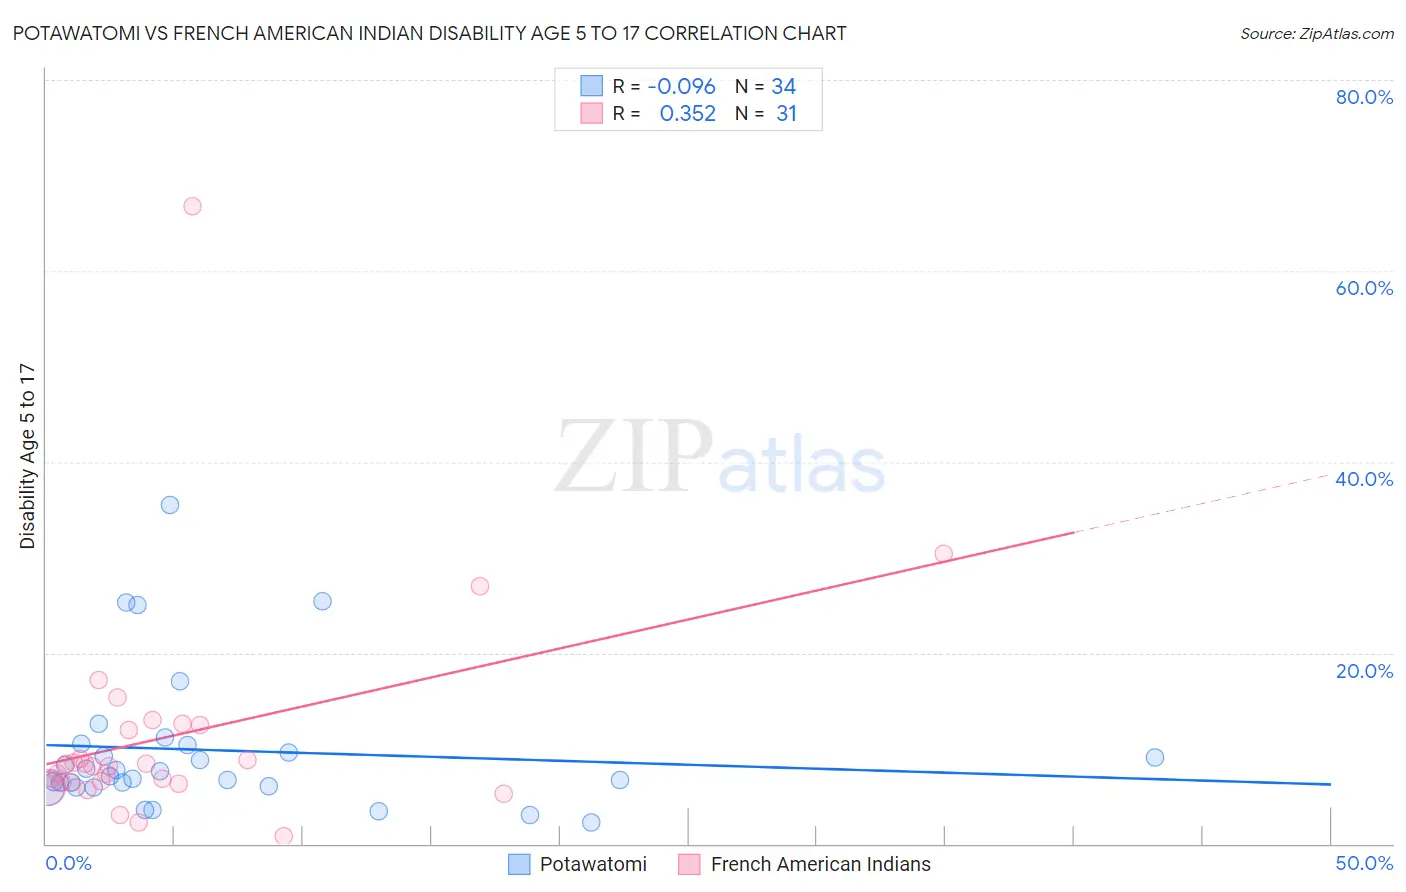
Potawatomi vs French American Indian Disability Age 5 to 17 Correlation Chart
The statistical analysis conducted on geographies consisting of 117,332,661 people shows a slight negative correlation between the proportion of Potawatomi and percentage of population with a disability between the ages 5 and 17 in the United States with a correlation coefficient (R) of -0.096 and weighted average of 6.5%. Similarly, the statistical analysis conducted on geographies consisting of 131,646,511 people shows a mild positive correlation between the proportion of French American Indians and percentage of population with a disability between the ages 5 and 17 in the United States with a correlation coefficient (R) of 0.352 and weighted average of 6.6%, a difference of 0.44%.
Disability Age 5 to 17 Correlation Summary
| Measurement | Potawatomi | French American Indian |
| Minimum | 2.2% | 0.85% |
| Maximum | 35.5% | 66.8% |
| Range | 33.3% | 65.9% |
| Mean | 9.8% | 11.3% |
| Median | 7.3% | 8.2% |
| Interquartile 25% (IQ1) | 6.1% | 6.4% |
| Interquartile 75% (IQ3) | 10.4% | 12.5% |
| Interquartile Range (IQR) | 4.3% | 6.1% |
| Standard Deviation (Sample) | 7.4% | 12.0% |
| Standard Deviation (Population) | 7.3% | 11.8% |
Demographics Similar to Potawatomi and French American Indians by Disability Age 5 to 17
In terms of disability age 5 to 17, the demographic groups most similar to Potawatomi are American (6.5%, a difference of 0.13%), Dominican (6.5%, a difference of 0.19%), Osage (6.5%, a difference of 0.27%), Slovak (6.5%, a difference of 0.31%), and Tohono O'odham (6.5%, a difference of 0.32%). Similarly, the demographic groups most similar to French American Indians are Pennsylvania German (6.6%, a difference of 0.23%), Blackfeet (6.6%, a difference of 0.40%), American (6.5%, a difference of 0.58%), Dominican (6.5%, a difference of 0.63%), and Osage (6.5%, a difference of 0.71%).
| Demographics | Rating | Rank | Disability Age 5 to 17 |
| Immigrants | Dominican Republic | 0.0 /100 | #316 | Tragic 6.4% |
| Kiowa | 0.0 /100 | #317 | Tragic 6.4% |
| Comanche | 0.0 /100 | #318 | Tragic 6.4% |
| Delaware | 0.0 /100 | #319 | Tragic 6.5% |
| Africans | 0.0 /100 | #320 | Tragic 6.5% |
| Tohono O'odham | 0.0 /100 | #321 | Tragic 6.5% |
| Slovaks | 0.0 /100 | #322 | Tragic 6.5% |
| Osage | 0.0 /100 | #323 | Tragic 6.5% |
| Dominicans | 0.0 /100 | #324 | Tragic 6.5% |
| Americans | 0.0 /100 | #325 | Tragic 6.5% |
| Potawatomi | 0.0 /100 | #326 | Tragic 6.5% |
| French American Indians | 0.0 /100 | #327 | Tragic 6.6% |
| Pennsylvania Germans | 0.0 /100 | #328 | Tragic 6.6% |
| Blackfeet | 0.0 /100 | #329 | Tragic 6.6% |
| Dutch West Indians | 0.0 /100 | #330 | Tragic 6.7% |
| French Canadians | 0.0 /100 | #331 | Tragic 6.7% |
| Immigrants | Azores | 0.0 /100 | #332 | Tragic 6.7% |
| Blacks/African Americans | 0.0 /100 | #333 | Tragic 6.8% |
| Seminole | 0.0 /100 | #334 | Tragic 6.8% |
| Ottawa | 0.0 /100 | #335 | Tragic 6.8% |
| Chickasaw | 0.0 /100 | #336 | Tragic 6.8% |