Potawatomi vs French American Indian Median Household Income
COMPARE
Potawatomi
French American Indian
Median Household Income
Median Household Income Comparison
Potawatomi
French American Indians
$72,576
MEDIAN HOUSEHOLD INCOME
0.0/ 100
METRIC RATING
306th/ 347
METRIC RANK
$76,387
MEDIAN HOUSEHOLD INCOME
0.4/ 100
METRIC RATING
262nd/ 347
METRIC RANK
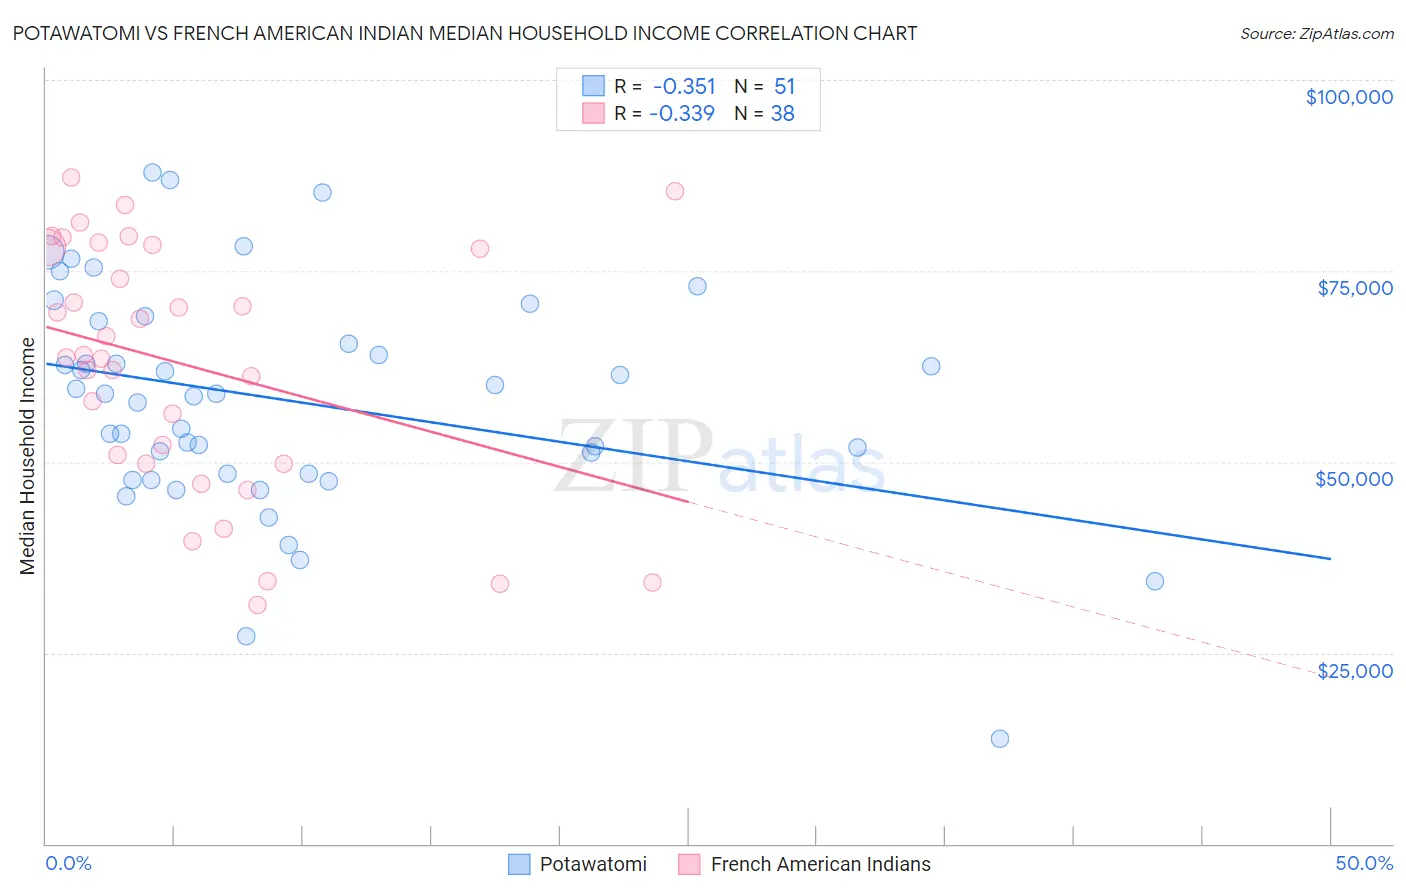
Potawatomi vs French American Indian Median Household Income Correlation Chart
The statistical analysis conducted on geographies consisting of 117,750,018 people shows a mild negative correlation between the proportion of Potawatomi and median household income in the United States with a correlation coefficient (R) of -0.351 and weighted average of $72,576. Similarly, the statistical analysis conducted on geographies consisting of 131,952,383 people shows a mild negative correlation between the proportion of French American Indians and median household income in the United States with a correlation coefficient (R) of -0.339 and weighted average of $76,387, a difference of 5.2%.
Median Household Income Correlation Summary
| Measurement | Potawatomi | French American Indian |
| Minimum | $13,750 | $31,325 |
| Maximum | $87,880 | $87,295 |
| Range | $74,130 | $55,970 |
| Mean | $58,038 | $62,652 |
| Median | $58,924 | $63,795 |
| Interquartile 25% (IQ1) | $48,403 | $49,785 |
| Interquartile 75% (IQ3) | $68,477 | $78,132 |
| Interquartile Range (IQR) | $20,074 | $28,346 |
| Standard Deviation (Sample) | $14,790 | $16,205 |
| Standard Deviation (Population) | $14,645 | $15,990 |
Similar Demographics by Median Household Income
Demographics Similar to Potawatomi by Median Household Income
In terms of median household income, the demographic groups most similar to Potawatomi are Honduran ($72,588, a difference of 0.020%), Immigrants from Haiti ($72,599, a difference of 0.030%), African ($72,650, a difference of 0.10%), Shoshone ($72,660, a difference of 0.12%), and Cherokee ($72,682, a difference of 0.15%).
| Demographics | Rating | Rank | Median Household Income |
| Indonesians | 0.0 /100 | #299 | Tragic $72,856 |
| Immigrants | Dominica | 0.0 /100 | #300 | Tragic $72,760 |
| Cherokee | 0.0 /100 | #301 | Tragic $72,682 |
| Shoshone | 0.0 /100 | #302 | Tragic $72,660 |
| Africans | 0.0 /100 | #303 | Tragic $72,650 |
| Immigrants | Haiti | 0.0 /100 | #304 | Tragic $72,599 |
| Hondurans | 0.0 /100 | #305 | Tragic $72,588 |
| Potawatomi | 0.0 /100 | #306 | Tragic $72,576 |
| Ute | 0.0 /100 | #307 | Tragic $72,402 |
| Yakama | 0.0 /100 | #308 | Tragic $72,225 |
| Immigrants | Caribbean | 0.0 /100 | #309 | Tragic $71,860 |
| U.S. Virgin Islanders | 0.0 /100 | #310 | Tragic $71,853 |
| Immigrants | Zaire | 0.0 /100 | #311 | Tragic $71,801 |
| Immigrants | Honduras | 0.0 /100 | #312 | Tragic $71,452 |
| Immigrants | Bahamas | 0.0 /100 | #313 | Tragic $71,349 |
Demographics Similar to French American Indians by Median Household Income
In terms of median household income, the demographic groups most similar to French American Indians are Alaskan Athabascan ($76,383, a difference of 0.010%), Immigrants from Grenada ($76,517, a difference of 0.17%), Jamaican ($76,583, a difference of 0.26%), Spanish American Indian ($76,670, a difference of 0.37%), and Immigrants from Nicaragua ($76,784, a difference of 0.52%).
| Demographics | Rating | Rank | Median Household Income |
| Immigrants | Middle Africa | 0.8 /100 | #255 | Tragic $77,559 |
| Belizeans | 0.6 /100 | #256 | Tragic $77,028 |
| Immigrants | Senegal | 0.5 /100 | #257 | Tragic $76,915 |
| Immigrants | Nicaragua | 0.5 /100 | #258 | Tragic $76,784 |
| Spanish American Indians | 0.4 /100 | #259 | Tragic $76,670 |
| Jamaicans | 0.4 /100 | #260 | Tragic $76,583 |
| Immigrants | Grenada | 0.4 /100 | #261 | Tragic $76,517 |
| French American Indians | 0.4 /100 | #262 | Tragic $76,387 |
| Alaskan Athabascans | 0.4 /100 | #263 | Tragic $76,383 |
| Guatemalans | 0.3 /100 | #264 | Tragic $75,961 |
| Immigrants | Belize | 0.3 /100 | #265 | Tragic $75,938 |
| Americans | 0.3 /100 | #266 | Tragic $75,932 |
| German Russians | 0.3 /100 | #267 | Tragic $75,856 |
| Immigrants | Jamaica | 0.3 /100 | #268 | Tragic $75,851 |
| Cape Verdeans | 0.3 /100 | #269 | Tragic $75,848 |