Cajun vs French American Indian Disability Age 5 to 17
COMPARE
Cajun
French American Indian
Disability Age 5 to 17
Disability Age 5 to 17 Comparison
Cajuns
French American Indians
7.2%
DISABILITY AGE 5 TO 17
0.0/ 100
METRIC RATING
344th/ 347
METRIC RANK
6.6%
DISABILITY AGE 5 TO 17
0.0/ 100
METRIC RATING
327th/ 347
METRIC RANK
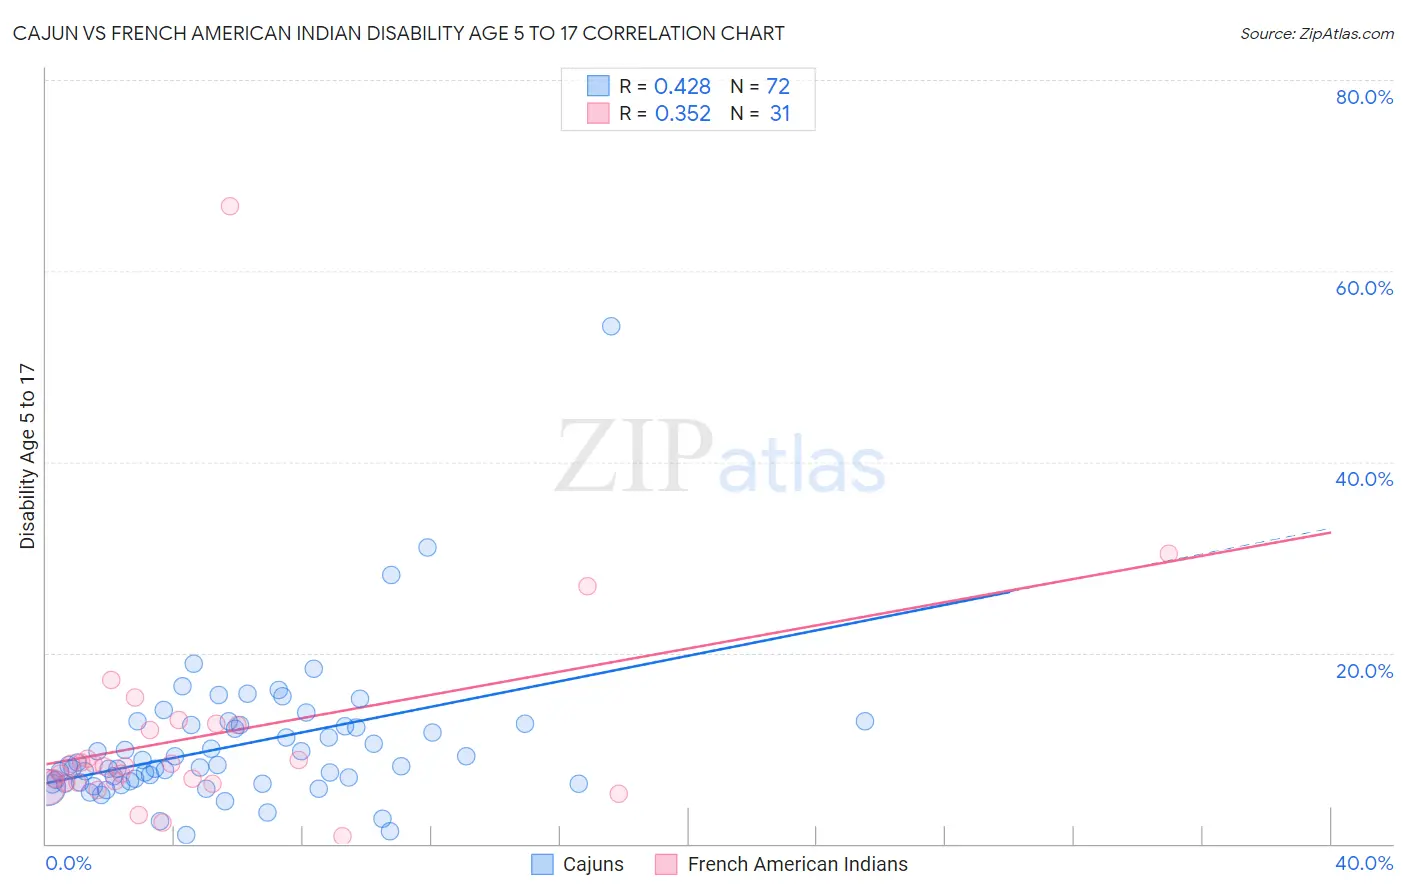
Cajun vs French American Indian Disability Age 5 to 17 Correlation Chart
The statistical analysis conducted on geographies consisting of 149,070,842 people shows a moderate positive correlation between the proportion of Cajuns and percentage of population with a disability between the ages 5 and 17 in the United States with a correlation coefficient (R) of 0.428 and weighted average of 7.2%. Similarly, the statistical analysis conducted on geographies consisting of 131,646,511 people shows a mild positive correlation between the proportion of French American Indians and percentage of population with a disability between the ages 5 and 17 in the United States with a correlation coefficient (R) of 0.352 and weighted average of 6.6%, a difference of 9.4%.
Disability Age 5 to 17 Correlation Summary
| Measurement | Cajun | French American Indian |
| Minimum | 0.98% | 0.85% |
| Maximum | 54.2% | 66.8% |
| Range | 53.2% | 65.9% |
| Mean | 10.3% | 11.3% |
| Median | 8.2% | 8.2% |
| Interquartile 25% (IQ1) | 6.4% | 6.4% |
| Interquartile 75% (IQ3) | 12.5% | 12.5% |
| Interquartile Range (IQR) | 6.1% | 6.1% |
| Standard Deviation (Sample) | 7.4% | 12.0% |
| Standard Deviation (Population) | 7.3% | 11.8% |
Demographics Similar to Cajuns and French American Indians by Disability Age 5 to 17
In terms of disability age 5 to 17, the demographic groups most similar to Cajuns are Immigrants from Cabo Verde (7.1%, a difference of 0.70%), Chippewa (7.1%, a difference of 0.96%), Cape Verdean (7.0%, a difference of 3.2%), Cherokee (6.9%, a difference of 3.7%), and Choctaw (6.9%, a difference of 4.0%). Similarly, the demographic groups most similar to French American Indians are Pennsylvania German (6.6%, a difference of 0.23%), Blackfeet (6.6%, a difference of 0.40%), Potawatomi (6.5%, a difference of 0.44%), American (6.5%, a difference of 0.58%), and Dutch West Indian (6.7%, a difference of 2.2%).
| Demographics | Rating | Rank | Disability Age 5 to 17 |
| Americans | 0.0 /100 | #325 | Tragic 6.5% |
| Potawatomi | 0.0 /100 | #326 | Tragic 6.5% |
| French American Indians | 0.0 /100 | #327 | Tragic 6.6% |
| Pennsylvania Germans | 0.0 /100 | #328 | Tragic 6.6% |
| Blackfeet | 0.0 /100 | #329 | Tragic 6.6% |
| Dutch West Indians | 0.0 /100 | #330 | Tragic 6.7% |
| French Canadians | 0.0 /100 | #331 | Tragic 6.7% |
| Immigrants | Azores | 0.0 /100 | #332 | Tragic 6.7% |
| Blacks/African Americans | 0.0 /100 | #333 | Tragic 6.8% |
| Seminole | 0.0 /100 | #334 | Tragic 6.8% |
| Ottawa | 0.0 /100 | #335 | Tragic 6.8% |
| Chickasaw | 0.0 /100 | #336 | Tragic 6.8% |
| Creek | 0.0 /100 | #337 | Tragic 6.9% |
| Iroquois | 0.0 /100 | #338 | Tragic 6.9% |
| Choctaw | 0.0 /100 | #339 | Tragic 6.9% |
| Cherokee | 0.0 /100 | #340 | Tragic 6.9% |
| Cape Verdeans | 0.0 /100 | #341 | Tragic 7.0% |
| Chippewa | 0.0 /100 | #342 | Tragic 7.1% |
| Immigrants | Cabo Verde | 0.0 /100 | #343 | Tragic 7.1% |
| Cajuns | 0.0 /100 | #344 | Tragic 7.2% |
| Tsimshian | 0.0 /100 | #345 | Tragic 7.9% |