Potawatomi vs French American Indian Master's Degree
COMPARE
Potawatomi
French American Indian
Master's Degree
Master's Degree Comparison
Potawatomi
French American Indians
12.1%
MASTER'S DEGREE
0.3/ 100
METRIC RATING
278th/ 347
METRIC RANK
12.7%
MASTER'S DEGREE
1.0/ 100
METRIC RATING
252nd/ 347
METRIC RANK
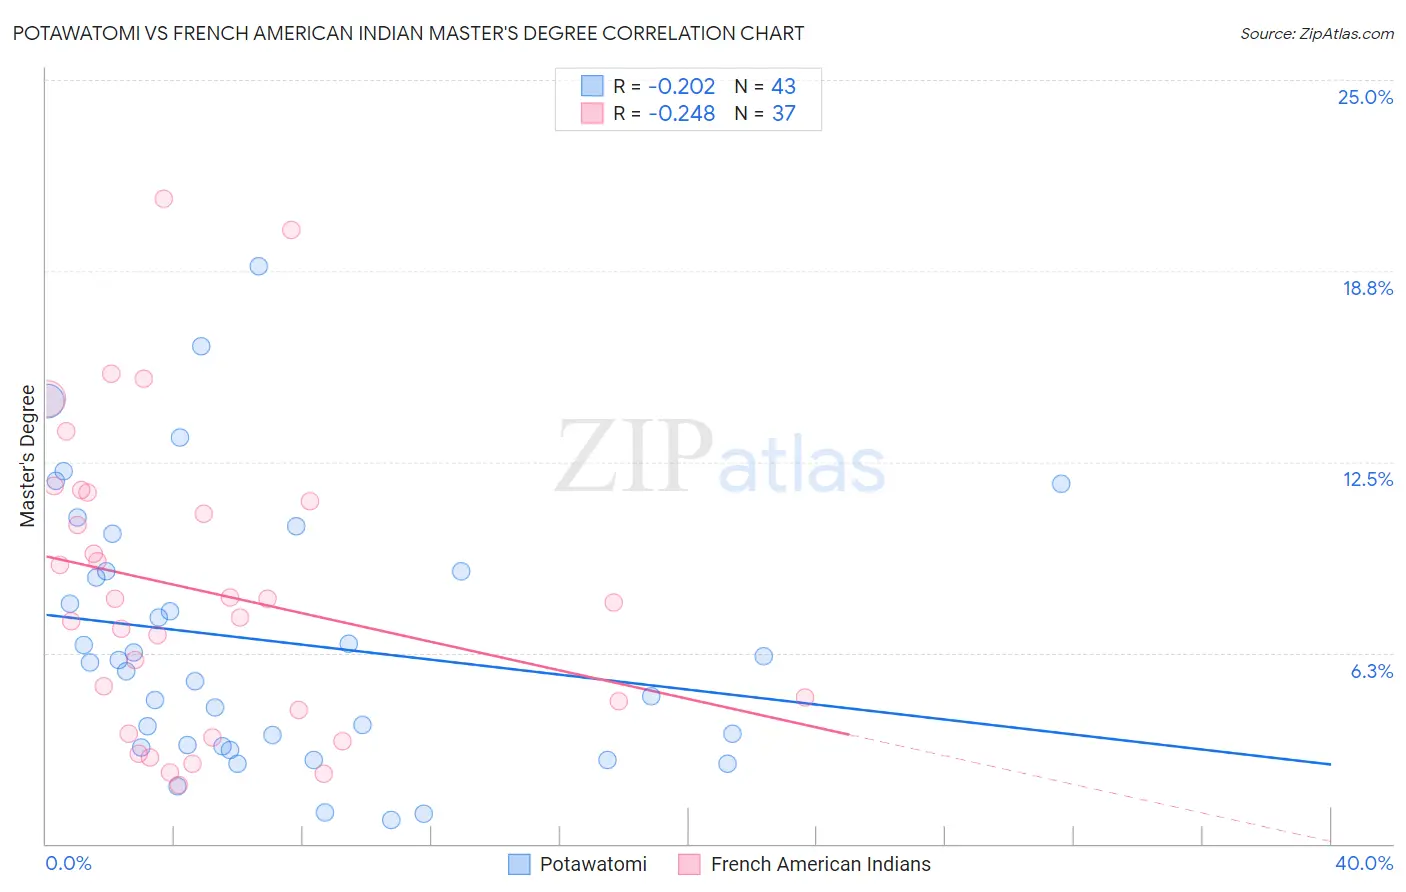
Potawatomi vs French American Indian Master's Degree Correlation Chart
The statistical analysis conducted on geographies consisting of 117,752,178 people shows a weak negative correlation between the proportion of Potawatomi and percentage of population with at least master's degree education in the United States with a correlation coefficient (R) of -0.202 and weighted average of 12.1%. Similarly, the statistical analysis conducted on geographies consisting of 131,966,823 people shows a weak negative correlation between the proportion of French American Indians and percentage of population with at least master's degree education in the United States with a correlation coefficient (R) of -0.248 and weighted average of 12.7%, a difference of 5.4%.
Master's Degree Correlation Summary
| Measurement | Potawatomi | French American Indian |
| Minimum | 0.76% | 1.9% |
| Maximum | 18.9% | 21.1% |
| Range | 18.1% | 19.2% |
| Mean | 6.6% | 8.3% |
| Median | 5.9% | 7.9% |
| Interquartile 25% (IQ1) | 3.2% | 4.0% |
| Interquartile 75% (IQ3) | 8.9% | 11.4% |
| Interquartile Range (IQR) | 5.7% | 7.4% |
| Standard Deviation (Sample) | 4.3% | 4.9% |
| Standard Deviation (Population) | 4.3% | 4.8% |
Similar Demographics by Master's Degree
Demographics Similar to Potawatomi by Master's Degree
In terms of master's degree, the demographic groups most similar to Potawatomi are Immigrants from Caribbean (12.1%, a difference of 0.0%), Black/African American (12.1%, a difference of 0.010%), Cuban (12.1%, a difference of 0.070%), Cape Verdean (12.1%, a difference of 0.080%), and Immigrants from Belize (12.1%, a difference of 0.080%).
| Demographics | Rating | Rank | Master's Degree |
| Haitians | 0.3 /100 | #271 | Tragic 12.1% |
| Comanche | 0.3 /100 | #272 | Tragic 12.1% |
| Blackfeet | 0.3 /100 | #273 | Tragic 12.1% |
| Cape Verdeans | 0.3 /100 | #274 | Tragic 12.1% |
| Cubans | 0.3 /100 | #275 | Tragic 12.1% |
| Blacks/African Americans | 0.3 /100 | #276 | Tragic 12.1% |
| Immigrants | Caribbean | 0.3 /100 | #277 | Tragic 12.1% |
| Potawatomi | 0.3 /100 | #278 | Tragic 12.1% |
| Immigrants | Belize | 0.2 /100 | #279 | Tragic 12.1% |
| Immigrants | Dominican Republic | 0.2 /100 | #280 | Tragic 12.1% |
| Malaysians | 0.2 /100 | #281 | Tragic 12.0% |
| Immigrants | El Salvador | 0.2 /100 | #282 | Tragic 12.0% |
| Hondurans | 0.2 /100 | #283 | Tragic 11.9% |
| Ottawa | 0.2 /100 | #284 | Tragic 11.9% |
| Immigrants | Nicaragua | 0.2 /100 | #285 | Tragic 11.8% |
Demographics Similar to French American Indians by Master's Degree
In terms of master's degree, the demographic groups most similar to French American Indians are Immigrants from Dominica (12.6%, a difference of 0.54%), Indonesian (12.6%, a difference of 0.59%), Immigrants from Congo (12.6%, a difference of 0.61%), Immigrants from Portugal (12.6%, a difference of 0.69%), and Tlingit-Haida (12.8%, a difference of 0.98%).
| Demographics | Rating | Rank | Master's Degree |
| Immigrants | Bahamas | 1.4 /100 | #245 | Tragic 12.9% |
| Immigrants | Cambodia | 1.4 /100 | #246 | Tragic 12.9% |
| Iroquois | 1.4 /100 | #247 | Tragic 12.9% |
| Africans | 1.4 /100 | #248 | Tragic 12.9% |
| Cree | 1.3 /100 | #249 | Tragic 12.8% |
| Liberians | 1.3 /100 | #250 | Tragic 12.8% |
| Tlingit-Haida | 1.3 /100 | #251 | Tragic 12.8% |
| French American Indians | 1.0 /100 | #252 | Tragic 12.7% |
| Immigrants | Dominica | 0.8 /100 | #253 | Tragic 12.6% |
| Indonesians | 0.8 /100 | #254 | Tragic 12.6% |
| Immigrants | Congo | 0.8 /100 | #255 | Tragic 12.6% |
| Immigrants | Portugal | 0.8 /100 | #256 | Tragic 12.6% |
| Osage | 0.7 /100 | #257 | Tragic 12.6% |
| Immigrants | Liberia | 0.6 /100 | #258 | Tragic 12.5% |
| Japanese | 0.6 /100 | #259 | Tragic 12.5% |