Portuguese vs Puerto Rican Disability
COMPARE
Portuguese
Puerto Rican
Disability
Disability Comparison
Portuguese
Puerto Ricans
12.6%
DISABILITY
0.1/ 100
METRIC RATING
270th/ 347
METRIC RANK
16.1%
DISABILITY
0.0/ 100
METRIC RATING
345th/ 347
METRIC RANK
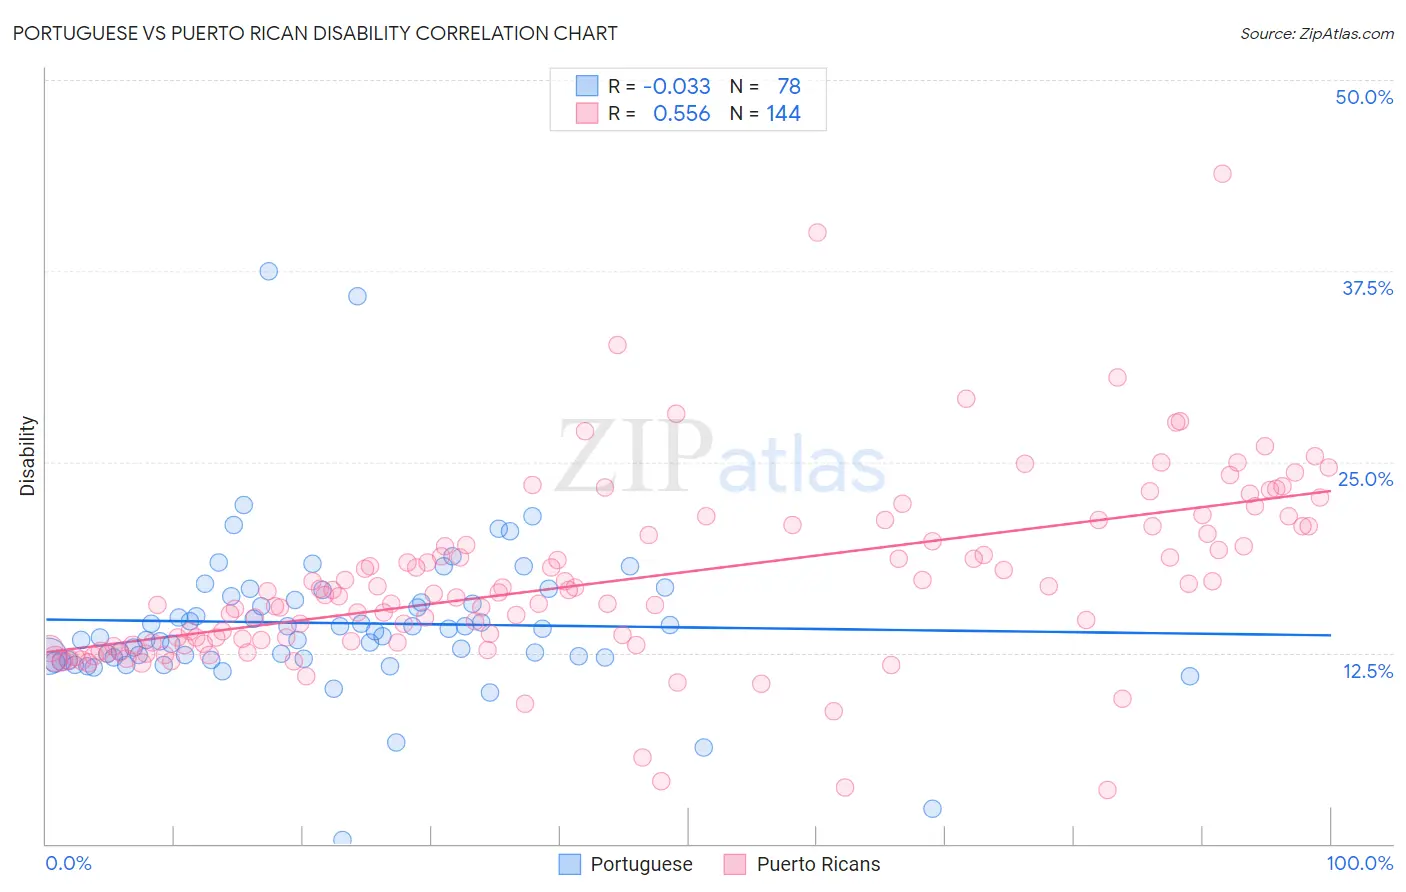
Portuguese vs Puerto Rican Disability Correlation Chart
The statistical analysis conducted on geographies consisting of 450,275,372 people shows no correlation between the proportion of Portuguese and percentage of population with a disability in the United States with a correlation coefficient (R) of -0.033 and weighted average of 12.6%. Similarly, the statistical analysis conducted on geographies consisting of 528,171,065 people shows a substantial positive correlation between the proportion of Puerto Ricans and percentage of population with a disability in the United States with a correlation coefficient (R) of 0.556 and weighted average of 16.1%, a difference of 27.6%.
Disability Correlation Summary
| Measurement | Portuguese | Puerto Rican |
| Minimum | 0.28% | 3.6% |
| Maximum | 37.5% | 43.9% |
| Range | 37.2% | 40.3% |
| Mean | 14.4% | 17.2% |
| Median | 13.8% | 16.4% |
| Interquartile 25% (IQ1) | 12.2% | 13.2% |
| Interquartile 75% (IQ3) | 15.9% | 20.5% |
| Interquartile Range (IQR) | 3.7% | 7.4% |
| Standard Deviation (Sample) | 5.1% | 6.0% |
| Standard Deviation (Population) | 5.1% | 6.0% |
Similar Demographics by Disability
Demographics Similar to Portuguese by Disability
In terms of disability, the demographic groups most similar to Portuguese are Immigrants from Yemen (12.6%, a difference of 0.050%), Immigrants from Dominican Republic (12.6%, a difference of 0.39%), Bangladeshi (12.6%, a difference of 0.48%), Dominican (12.7%, a difference of 0.54%), and Finnish (12.7%, a difference of 0.70%).
| Demographics | Rating | Rank | Disability |
| Hawaiians | 0.2 /100 | #263 | Tragic 12.5% |
| Immigrants | Germany | 0.2 /100 | #264 | Tragic 12.5% |
| U.S. Virgin Islanders | 0.2 /100 | #265 | Tragic 12.5% |
| Czechoslovakians | 0.2 /100 | #266 | Tragic 12.5% |
| Spaniards | 0.2 /100 | #267 | Tragic 12.5% |
| Bangladeshis | 0.1 /100 | #268 | Tragic 12.6% |
| Immigrants | Dominican Republic | 0.1 /100 | #269 | Tragic 12.6% |
| Portuguese | 0.1 /100 | #270 | Tragic 12.6% |
| Immigrants | Yemen | 0.1 /100 | #271 | Tragic 12.6% |
| Dominicans | 0.0 /100 | #272 | Tragic 12.7% |
| Finns | 0.0 /100 | #273 | Tragic 12.7% |
| Nepalese | 0.0 /100 | #274 | Tragic 12.8% |
| Sioux | 0.0 /100 | #275 | Tragic 12.8% |
| Hmong | 0.0 /100 | #276 | Tragic 12.8% |
| Dutch | 0.0 /100 | #277 | Tragic 12.8% |
Demographics Similar to Puerto Ricans by Disability
In terms of disability, the demographic groups most similar to Puerto Ricans are Tsimshian (16.1%, a difference of 0.16%), Colville (15.8%, a difference of 2.0%), Creek (15.6%, a difference of 3.3%), Kiowa (15.6%, a difference of 3.3%), and Lumbee (15.5%, a difference of 3.8%).
| Demographics | Rating | Rank | Disability |
| Cajuns | 0.0 /100 | #333 | Tragic 14.6% |
| Yuman | 0.0 /100 | #334 | Tragic 14.6% |
| Tohono O'odham | 0.0 /100 | #335 | Tragic 14.8% |
| Cherokee | 0.0 /100 | #336 | Tragic 14.8% |
| Seminole | 0.0 /100 | #337 | Tragic 14.9% |
| Dutch West Indians | 0.0 /100 | #338 | Tragic 14.9% |
| Chickasaw | 0.0 /100 | #339 | Tragic 15.2% |
| Choctaw | 0.0 /100 | #340 | Tragic 15.4% |
| Lumbee | 0.0 /100 | #341 | Tragic 15.5% |
| Kiowa | 0.0 /100 | #342 | Tragic 15.6% |
| Creek | 0.0 /100 | #343 | Tragic 15.6% |
| Colville | 0.0 /100 | #344 | Tragic 15.8% |
| Puerto Ricans | 0.0 /100 | #345 | Tragic 16.1% |
| Tsimshian | 0.0 /100 | #346 | Tragic 16.1% |
| Houma | 0.0 /100 | #347 | Tragic 17.1% |