Portuguese vs Arab Disability
COMPARE
Portuguese
Arab
Disability
Disability Comparison
Portuguese
Arabs
12.6%
DISABILITY
0.1/ 100
METRIC RATING
270th/ 347
METRIC RANK
11.4%
DISABILITY
89.1/ 100
METRIC RATING
133rd/ 347
METRIC RANK
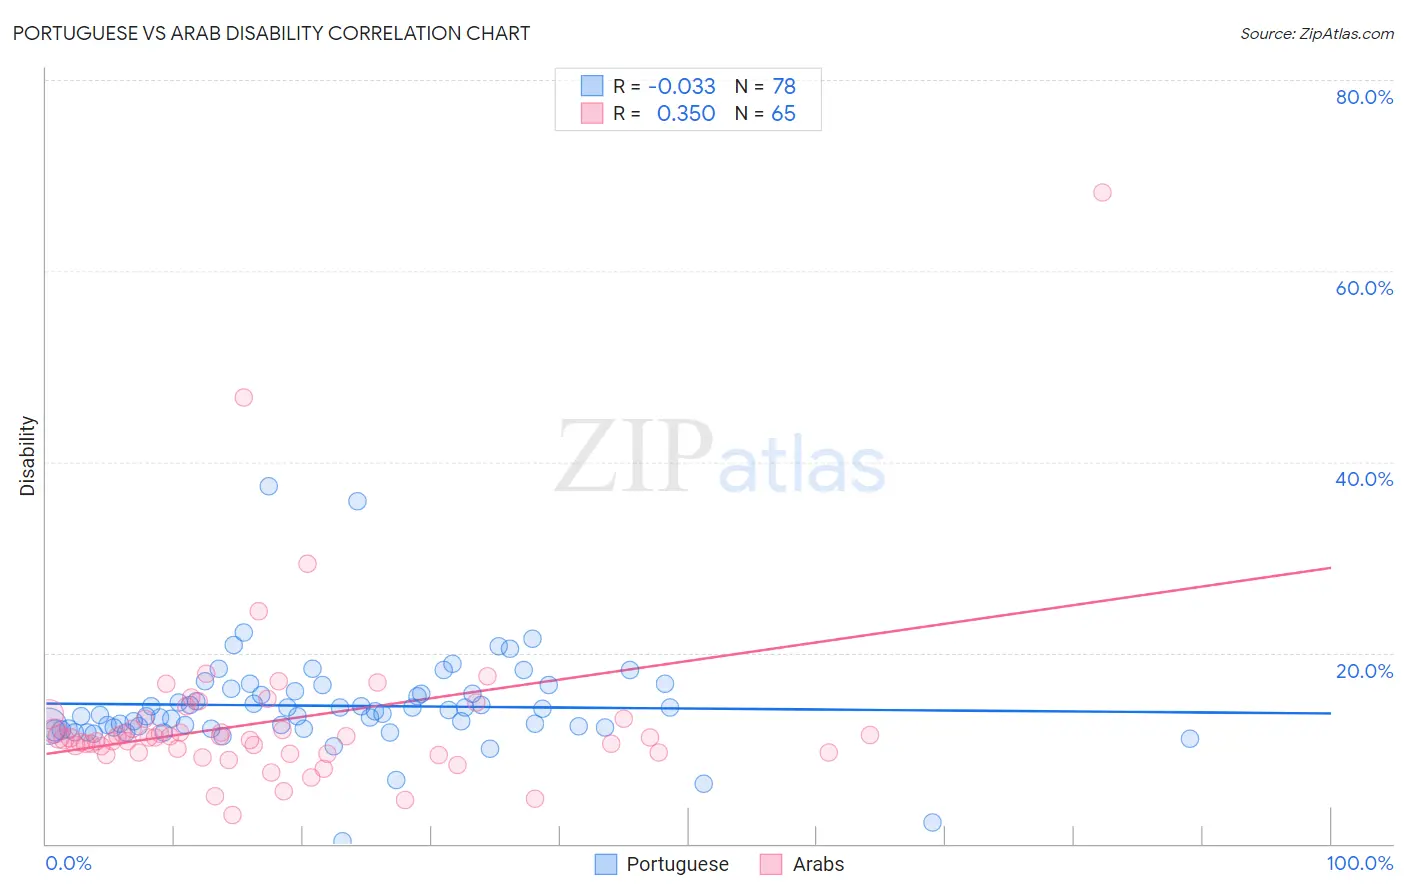
Portuguese vs Arab Disability Correlation Chart
The statistical analysis conducted on geographies consisting of 450,275,372 people shows no correlation between the proportion of Portuguese and percentage of population with a disability in the United States with a correlation coefficient (R) of -0.033 and weighted average of 12.6%. Similarly, the statistical analysis conducted on geographies consisting of 486,795,543 people shows a mild positive correlation between the proportion of Arabs and percentage of population with a disability in the United States with a correlation coefficient (R) of 0.350 and weighted average of 11.4%, a difference of 10.5%.
Disability Correlation Summary
| Measurement | Portuguese | Arab |
| Minimum | 0.28% | 3.0% |
| Maximum | 37.5% | 68.2% |
| Range | 37.2% | 65.2% |
| Mean | 14.4% | 12.9% |
| Median | 13.8% | 11.1% |
| Interquartile 25% (IQ1) | 12.2% | 9.6% |
| Interquartile 75% (IQ3) | 15.9% | 13.1% |
| Interquartile Range (IQR) | 3.7% | 3.5% |
| Standard Deviation (Sample) | 5.1% | 9.2% |
| Standard Deviation (Population) | 5.1% | 9.1% |
Similar Demographics by Disability
Demographics Similar to Portuguese by Disability
In terms of disability, the demographic groups most similar to Portuguese are Immigrants from Yemen (12.6%, a difference of 0.050%), Immigrants from Dominican Republic (12.6%, a difference of 0.39%), Bangladeshi (12.6%, a difference of 0.48%), Dominican (12.7%, a difference of 0.54%), and Finnish (12.7%, a difference of 0.70%).
| Demographics | Rating | Rank | Disability |
| Hawaiians | 0.2 /100 | #263 | Tragic 12.5% |
| Immigrants | Germany | 0.2 /100 | #264 | Tragic 12.5% |
| U.S. Virgin Islanders | 0.2 /100 | #265 | Tragic 12.5% |
| Czechoslovakians | 0.2 /100 | #266 | Tragic 12.5% |
| Spaniards | 0.2 /100 | #267 | Tragic 12.5% |
| Bangladeshis | 0.1 /100 | #268 | Tragic 12.6% |
| Immigrants | Dominican Republic | 0.1 /100 | #269 | Tragic 12.6% |
| Portuguese | 0.1 /100 | #270 | Tragic 12.6% |
| Immigrants | Yemen | 0.1 /100 | #271 | Tragic 12.6% |
| Dominicans | 0.0 /100 | #272 | Tragic 12.7% |
| Finns | 0.0 /100 | #273 | Tragic 12.7% |
| Nepalese | 0.0 /100 | #274 | Tragic 12.8% |
| Sioux | 0.0 /100 | #275 | Tragic 12.8% |
| Hmong | 0.0 /100 | #276 | Tragic 12.8% |
| Dutch | 0.0 /100 | #277 | Tragic 12.8% |
Demographics Similar to Arabs by Disability
In terms of disability, the demographic groups most similar to Arabs are Immigrants from Africa (11.4%, a difference of 0.030%), Immigrants from Croatia (11.4%, a difference of 0.080%), Immigrants from Guyana (11.4%, a difference of 0.080%), Latvian (11.4%, a difference of 0.090%), and Ugandan (11.4%, a difference of 0.13%).
| Demographics | Rating | Rank | Disability |
| Immigrants | Latvia | 90.9 /100 | #126 | Exceptional 11.4% |
| Immigrants | Italy | 90.4 /100 | #127 | Exceptional 11.4% |
| Immigrants | Europe | 90.4 /100 | #128 | Exceptional 11.4% |
| Macedonians | 90.3 /100 | #129 | Exceptional 11.4% |
| Latvians | 89.8 /100 | #130 | Excellent 11.4% |
| Immigrants | Croatia | 89.8 /100 | #131 | Excellent 11.4% |
| Immigrants | Africa | 89.3 /100 | #132 | Excellent 11.4% |
| Arabs | 89.1 /100 | #133 | Excellent 11.4% |
| Immigrants | Guyana | 88.3 /100 | #134 | Excellent 11.4% |
| Ugandans | 87.9 /100 | #135 | Excellent 11.4% |
| Immigrants | St. Vincent and the Grenadines | 87.8 /100 | #136 | Excellent 11.4% |
| Kenyans | 87.1 /100 | #137 | Excellent 11.5% |
| New Zealanders | 87.0 /100 | #138 | Excellent 11.5% |
| Ghanaians | 87.0 /100 | #139 | Excellent 11.5% |
| Russians | 86.8 /100 | #140 | Excellent 11.5% |