Portuguese vs Korean Disability
COMPARE
Portuguese
Korean
Disability
Disability Comparison
Portuguese
Koreans
12.6%
DISABILITY
0.1/ 100
METRIC RATING
270th/ 347
METRIC RANK
11.3%
DISABILITY
93.8/ 100
METRIC RATING
118th/ 347
METRIC RANK
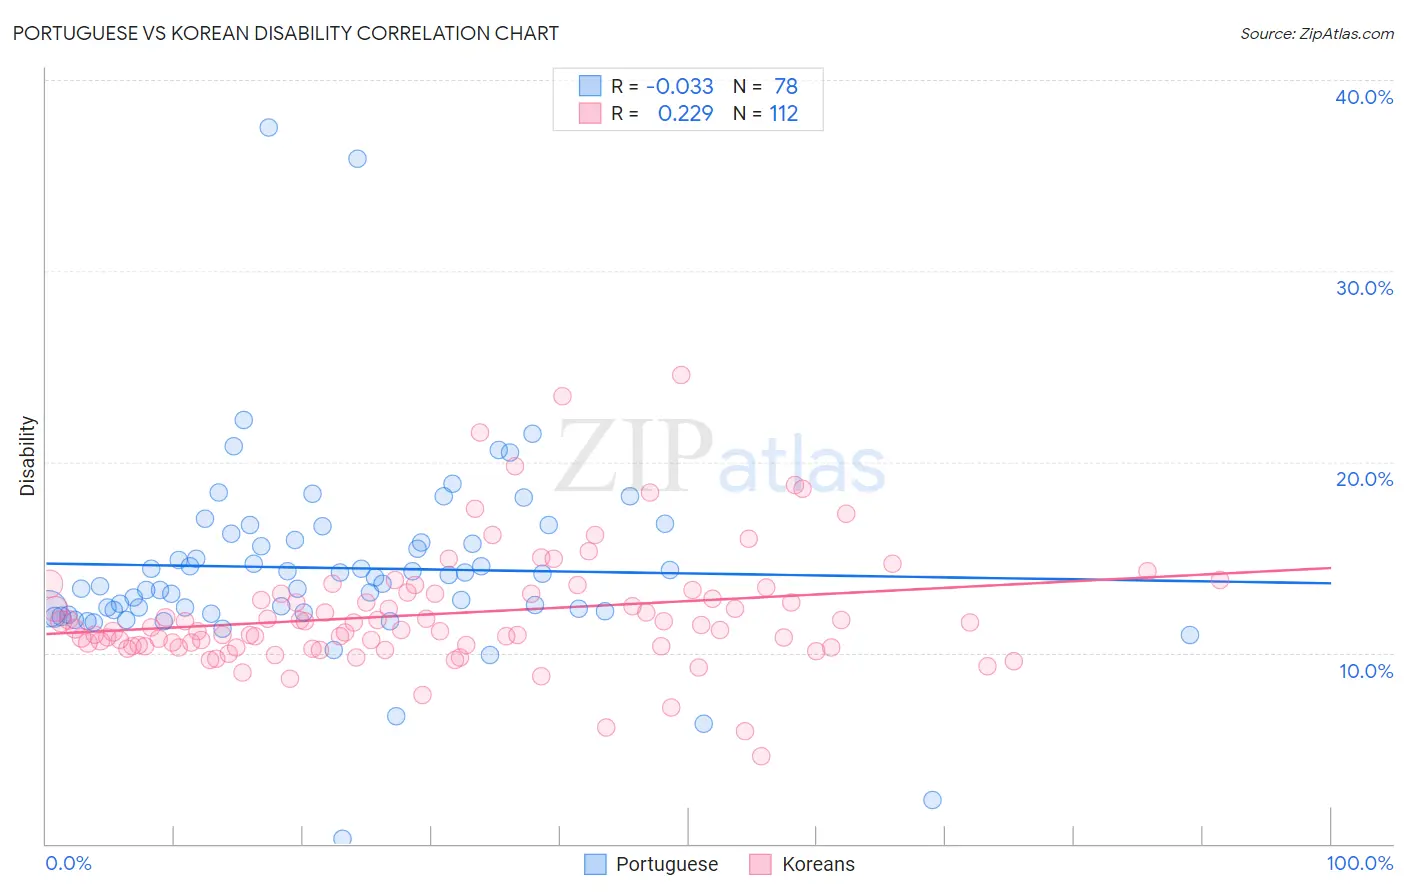
Portuguese vs Korean Disability Correlation Chart
The statistical analysis conducted on geographies consisting of 450,275,372 people shows no correlation between the proportion of Portuguese and percentage of population with a disability in the United States with a correlation coefficient (R) of -0.033 and weighted average of 12.6%. Similarly, the statistical analysis conducted on geographies consisting of 510,851,171 people shows a weak positive correlation between the proportion of Koreans and percentage of population with a disability in the United States with a correlation coefficient (R) of 0.229 and weighted average of 11.3%, a difference of 11.2%.
Disability Correlation Summary
| Measurement | Portuguese | Korean |
| Minimum | 0.28% | 4.6% |
| Maximum | 37.5% | 24.5% |
| Range | 37.2% | 20.0% |
| Mean | 14.4% | 12.1% |
| Median | 13.8% | 11.3% |
| Interquartile 25% (IQ1) | 12.2% | 10.3% |
| Interquartile 75% (IQ3) | 15.9% | 13.1% |
| Interquartile Range (IQR) | 3.7% | 2.8% |
| Standard Deviation (Sample) | 5.1% | 3.1% |
| Standard Deviation (Population) | 5.1% | 3.1% |
Similar Demographics by Disability
Demographics Similar to Portuguese by Disability
In terms of disability, the demographic groups most similar to Portuguese are Immigrants from Yemen (12.6%, a difference of 0.050%), Immigrants from Dominican Republic (12.6%, a difference of 0.39%), Bangladeshi (12.6%, a difference of 0.48%), Dominican (12.7%, a difference of 0.54%), and Finnish (12.7%, a difference of 0.70%).
| Demographics | Rating | Rank | Disability |
| Hawaiians | 0.2 /100 | #263 | Tragic 12.5% |
| Immigrants | Germany | 0.2 /100 | #264 | Tragic 12.5% |
| U.S. Virgin Islanders | 0.2 /100 | #265 | Tragic 12.5% |
| Czechoslovakians | 0.2 /100 | #266 | Tragic 12.5% |
| Spaniards | 0.2 /100 | #267 | Tragic 12.5% |
| Bangladeshis | 0.1 /100 | #268 | Tragic 12.6% |
| Immigrants | Dominican Republic | 0.1 /100 | #269 | Tragic 12.6% |
| Portuguese | 0.1 /100 | #270 | Tragic 12.6% |
| Immigrants | Yemen | 0.1 /100 | #271 | Tragic 12.6% |
| Dominicans | 0.0 /100 | #272 | Tragic 12.7% |
| Finns | 0.0 /100 | #273 | Tragic 12.7% |
| Nepalese | 0.0 /100 | #274 | Tragic 12.8% |
| Sioux | 0.0 /100 | #275 | Tragic 12.8% |
| Hmong | 0.0 /100 | #276 | Tragic 12.8% |
| Dutch | 0.0 /100 | #277 | Tragic 12.8% |
Demographics Similar to Koreans by Disability
In terms of disability, the demographic groups most similar to Koreans are Luxembourger (11.3%, a difference of 0.010%), Central American (11.4%, a difference of 0.050%), Immigrants from North Macedonia (11.4%, a difference of 0.060%), Immigrants from Northern Europe (11.3%, a difference of 0.070%), and Immigrants from Costa Rica (11.4%, a difference of 0.070%).
| Demographics | Rating | Rank | Disability |
| Immigrants | South Eastern Asia | 95.4 /100 | #111 | Exceptional 11.3% |
| Immigrants | Uzbekistan | 94.9 /100 | #112 | Exceptional 11.3% |
| Guyanese | 94.7 /100 | #113 | Exceptional 11.3% |
| Immigrants | Syria | 94.7 /100 | #114 | Exceptional 11.3% |
| Immigrants | Philippines | 94.6 /100 | #115 | Exceptional 11.3% |
| Immigrants | Northern Europe | 94.1 /100 | #116 | Exceptional 11.3% |
| Luxembourgers | 93.9 /100 | #117 | Exceptional 11.3% |
| Koreans | 93.8 /100 | #118 | Exceptional 11.3% |
| Central Americans | 93.5 /100 | #119 | Exceptional 11.4% |
| Immigrants | North Macedonia | 93.5 /100 | #120 | Exceptional 11.4% |
| Immigrants | Costa Rica | 93.4 /100 | #121 | Exceptional 11.4% |
| Brazilians | 93.3 /100 | #122 | Exceptional 11.4% |
| South Africans | 92.3 /100 | #123 | Exceptional 11.4% |
| South American Indians | 92.2 /100 | #124 | Exceptional 11.4% |
| Costa Ricans | 91.9 /100 | #125 | Exceptional 11.4% |