Pima vs Spanish American Indian Disability
COMPARE
Pima
Spanish American Indian
Disability
Disability Comparison
Pima
Spanish American Indians
13.7%
DISABILITY
0.0/ 100
METRIC RATING
316th/ 347
METRIC RANK
12.1%
DISABILITY
4.1/ 100
METRIC RATING
222nd/ 347
METRIC RANK
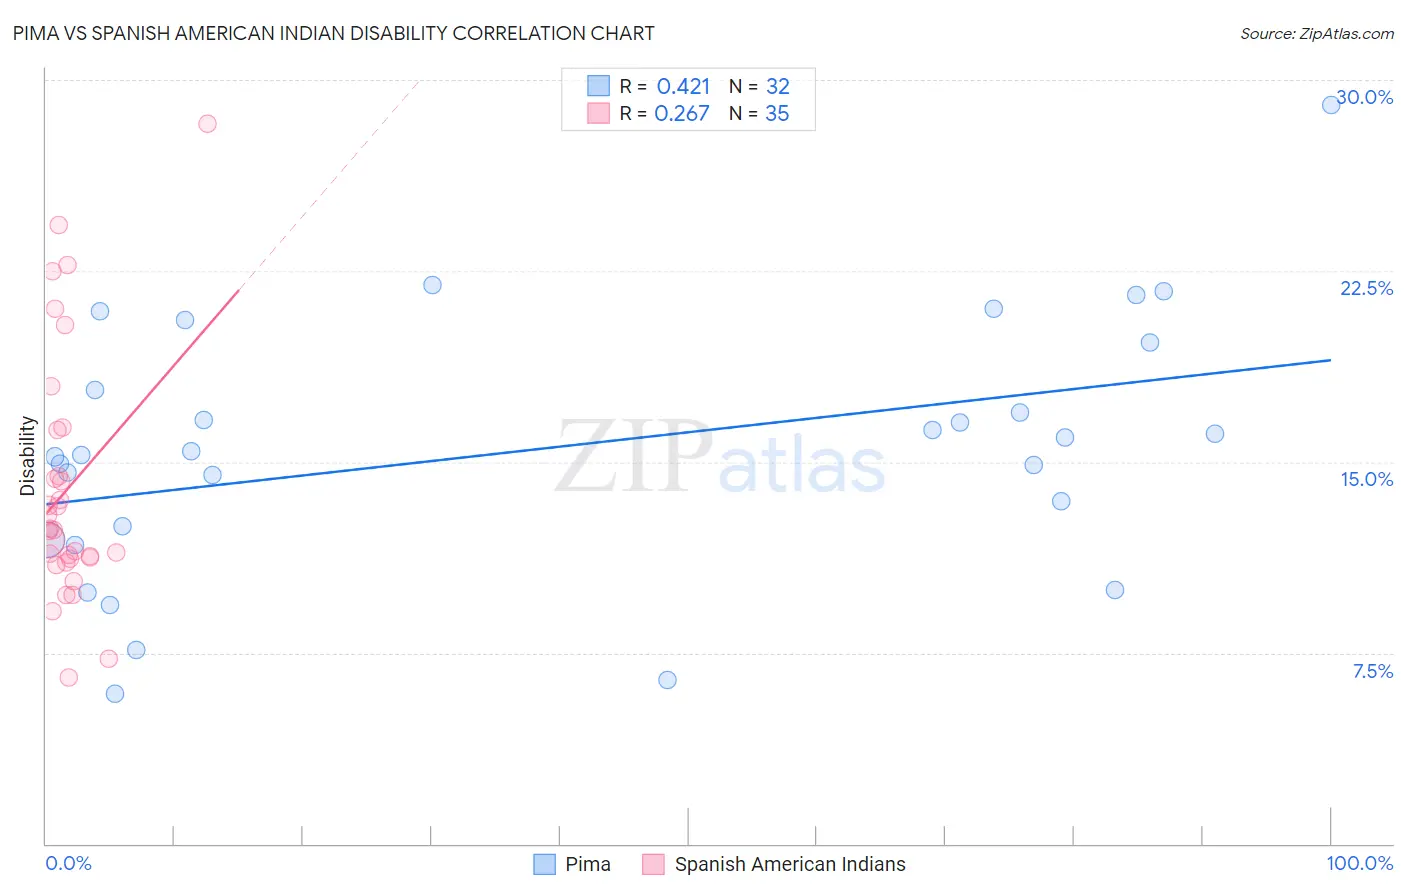
Pima vs Spanish American Indian Disability Correlation Chart
The statistical analysis conducted on geographies consisting of 61,542,416 people shows a moderate positive correlation between the proportion of Pima and percentage of population with a disability in the United States with a correlation coefficient (R) of 0.421 and weighted average of 13.7%. Similarly, the statistical analysis conducted on geographies consisting of 73,149,525 people shows a weak positive correlation between the proportion of Spanish American Indians and percentage of population with a disability in the United States with a correlation coefficient (R) of 0.267 and weighted average of 12.1%, a difference of 13.2%.
Disability Correlation Summary
| Measurement | Pima | Spanish American Indian |
| Minimum | 5.9% | 6.5% |
| Maximum | 29.0% | 28.3% |
| Range | 23.1% | 21.7% |
| Mean | 15.5% | 14.0% |
| Median | 15.3% | 12.3% |
| Interquartile 25% (IQ1) | 12.2% | 11.2% |
| Interquartile 75% (IQ3) | 18.7% | 16.3% |
| Interquartile Range (IQR) | 6.5% | 5.1% |
| Standard Deviation (Sample) | 5.1% | 4.9% |
| Standard Deviation (Population) | 5.0% | 4.9% |
Similar Demographics by Disability
Demographics Similar to Pima by Disability
In terms of disability, the demographic groups most similar to Pima are Immigrants from Cabo Verde (13.7%, a difference of 0.0%), Black/African American (13.7%, a difference of 0.030%), Puget Sound Salish (13.7%, a difference of 0.030%), Cree (13.7%, a difference of 0.070%), and Spanish American (13.6%, a difference of 0.42%).
| Demographics | Rating | Rank | Disability |
| Tlingit-Haida | 0.0 /100 | #309 | Tragic 13.5% |
| Blackfeet | 0.0 /100 | #310 | Tragic 13.6% |
| Delaware | 0.0 /100 | #311 | Tragic 13.6% |
| Spanish Americans | 0.0 /100 | #312 | Tragic 13.6% |
| Cree | 0.0 /100 | #313 | Tragic 13.7% |
| Blacks/African Americans | 0.0 /100 | #314 | Tragic 13.7% |
| Puget Sound Salish | 0.0 /100 | #315 | Tragic 13.7% |
| Pima | 0.0 /100 | #316 | Tragic 13.7% |
| Immigrants | Cabo Verde | 0.0 /100 | #317 | Tragic 13.7% |
| Menominee | 0.0 /100 | #318 | Tragic 13.8% |
| Iroquois | 0.0 /100 | #319 | Tragic 13.8% |
| Apache | 0.0 /100 | #320 | Tragic 13.9% |
| Paiute | 0.0 /100 | #321 | Tragic 13.9% |
| Americans | 0.0 /100 | #322 | Tragic 13.9% |
| Comanche | 0.0 /100 | #323 | Tragic 14.1% |
Demographics Similar to Spanish American Indians by Disability
In terms of disability, the demographic groups most similar to Spanish American Indians are Northern European (12.1%, a difference of 0.040%), Hispanic or Latino (12.1%, a difference of 0.040%), Mexican (12.1%, a difference of 0.10%), Immigrants from Bahamas (12.1%, a difference of 0.16%), and Senegalese (12.1%, a difference of 0.18%).
| Demographics | Rating | Rank | Disability |
| Immigrants | Canada | 6.1 /100 | #215 | Tragic 12.1% |
| Panamanians | 5.4 /100 | #216 | Tragic 12.1% |
| Immigrants | North America | 5.3 /100 | #217 | Tragic 12.1% |
| Immigrants | Jamaica | 5.0 /100 | #218 | Tragic 12.1% |
| Croatians | 4.9 /100 | #219 | Tragic 12.1% |
| Immigrants | Bahamas | 4.7 /100 | #220 | Tragic 12.1% |
| Northern Europeans | 4.2 /100 | #221 | Tragic 12.1% |
| Spanish American Indians | 4.1 /100 | #222 | Tragic 12.1% |
| Hispanics or Latinos | 3.9 /100 | #223 | Tragic 12.1% |
| Mexicans | 3.7 /100 | #224 | Tragic 12.1% |
| Senegalese | 3.5 /100 | #225 | Tragic 12.1% |
| Jamaicans | 3.3 /100 | #226 | Tragic 12.1% |
| Alsatians | 3.3 /100 | #227 | Tragic 12.1% |
| West Indians | 2.9 /100 | #228 | Tragic 12.2% |
| Inupiat | 2.8 /100 | #229 | Tragic 12.2% |