Pima vs Immigrants from West Indies 8th Grade
COMPARE
Pima
Immigrants from West Indies
8th Grade
8th Grade Comparison
Pima
Immigrants from West Indies
95.6%
8TH GRADE
28.6/ 100
METRIC RATING
192nd/ 347
METRIC RANK
94.3%
8TH GRADE
0.0/ 100
METRIC RATING
290th/ 347
METRIC RANK
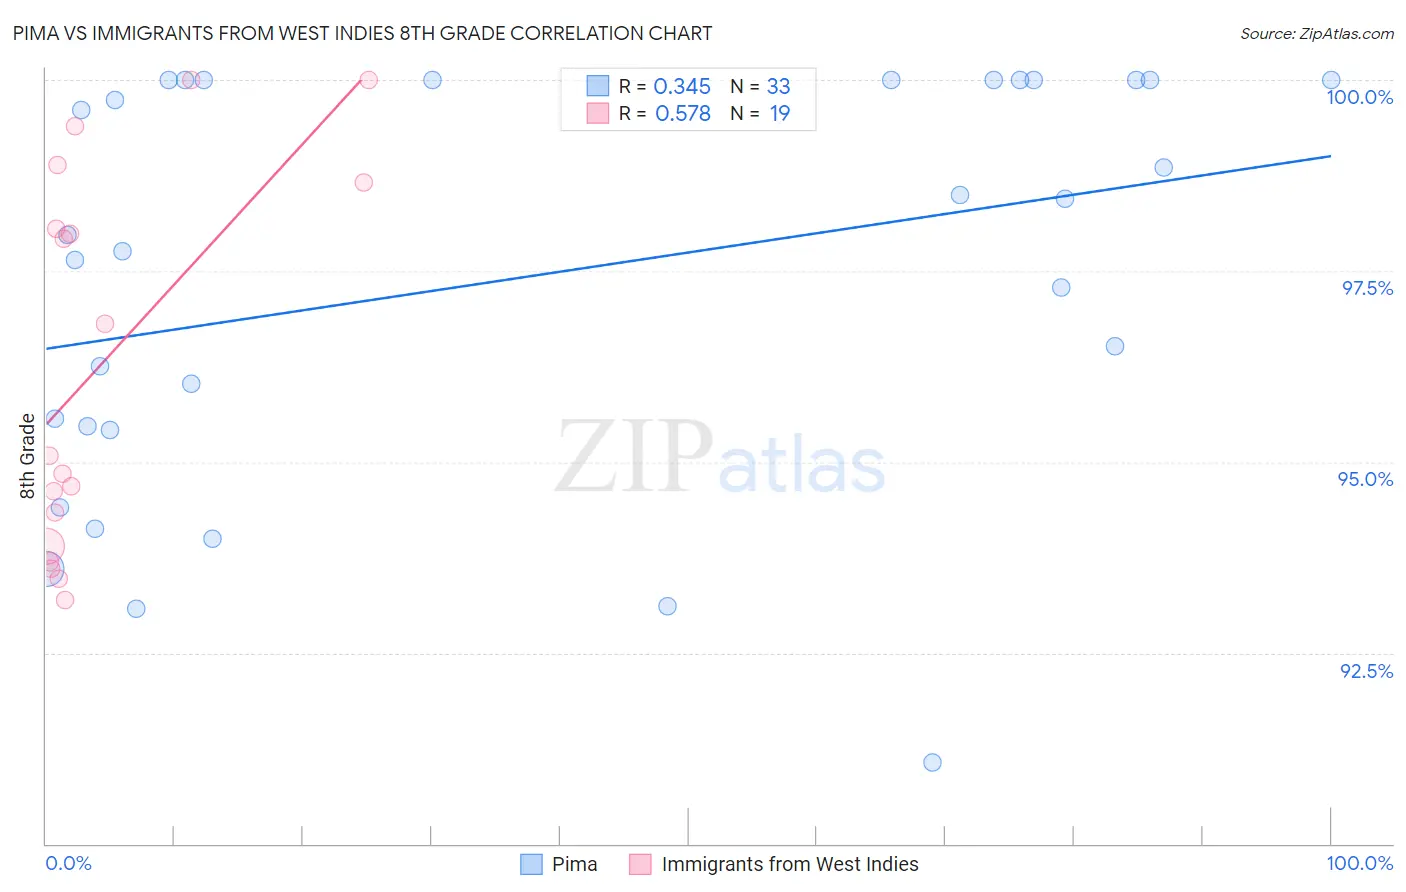
Pima vs Immigrants from West Indies 8th Grade Correlation Chart
The statistical analysis conducted on geographies consisting of 61,552,136 people shows a mild positive correlation between the proportion of Pima and percentage of population with at least 8th grade education in the United States with a correlation coefficient (R) of 0.345 and weighted average of 95.6%. Similarly, the statistical analysis conducted on geographies consisting of 72,457,514 people shows a substantial positive correlation between the proportion of Immigrants from West Indies and percentage of population with at least 8th grade education in the United States with a correlation coefficient (R) of 0.578 and weighted average of 94.3%, a difference of 1.3%.
8th Grade Correlation Summary
| Measurement | Pima | Immigrants from West Indies |
| Minimum | 91.1% | 93.2% |
| Maximum | 100.0% | 100.0% |
| Range | 8.9% | 6.8% |
| Mean | 97.4% | 96.3% |
| Median | 98.0% | 95.1% |
| Interquartile 25% (IQ1) | 95.4% | 93.9% |
| Interquartile 75% (IQ3) | 100.0% | 98.7% |
| Interquartile Range (IQR) | 4.6% | 4.8% |
| Standard Deviation (Sample) | 2.7% | 2.5% |
| Standard Deviation (Population) | 2.6% | 2.4% |
Similar Demographics by 8th Grade
Demographics Similar to Pima by 8th Grade
In terms of 8th grade, the demographic groups most similar to Pima are Panamanian (95.6%, a difference of 0.0%), Immigrants from Nepal (95.6%, a difference of 0.010%), Immigrants from Micronesia (95.6%, a difference of 0.020%), Immigrants from Venezuela (95.6%, a difference of 0.020%), and Guamanian/Chamorro (95.6%, a difference of 0.020%).
| Demographics | Rating | Rank | 8th Grade |
| Blacks/African Americans | 34.8 /100 | #185 | Fair 95.6% |
| Brazilians | 34.8 /100 | #186 | Fair 95.6% |
| Sudanese | 33.0 /100 | #187 | Fair 95.6% |
| Liberians | 32.4 /100 | #188 | Fair 95.6% |
| Immigrants | Micronesia | 31.6 /100 | #189 | Fair 95.6% |
| Immigrants | Venezuela | 30.8 /100 | #190 | Fair 95.6% |
| Immigrants | Nepal | 30.2 /100 | #191 | Fair 95.6% |
| Pima | 28.6 /100 | #192 | Fair 95.6% |
| Panamanians | 28.4 /100 | #193 | Fair 95.6% |
| Guamanians/Chamorros | 26.6 /100 | #194 | Fair 95.6% |
| Immigrants | Zaire | 25.2 /100 | #195 | Fair 95.6% |
| Assyrians/Chaldeans/Syriacs | 24.5 /100 | #196 | Fair 95.6% |
| Sierra Leoneans | 24.3 /100 | #197 | Fair 95.6% |
| Paraguayans | 22.6 /100 | #198 | Fair 95.5% |
| Immigrants | Northern Africa | 22.5 /100 | #199 | Fair 95.5% |
Demographics Similar to Immigrants from West Indies by 8th Grade
In terms of 8th grade, the demographic groups most similar to Immigrants from West Indies are Immigrants from Grenada (94.3%, a difference of 0.010%), British West Indian (94.4%, a difference of 0.070%), Bangladeshi (94.3%, a difference of 0.080%), Yaqui (94.2%, a difference of 0.11%), and Houma (94.2%, a difference of 0.12%).
| Demographics | Rating | Rank | 8th Grade |
| Immigrants | St. Vincent and the Grenadines | 0.1 /100 | #283 | Tragic 94.6% |
| Immigrants | Philippines | 0.1 /100 | #284 | Tragic 94.6% |
| Immigrants | Barbados | 0.0 /100 | #285 | Tragic 94.5% |
| Immigrants | Peru | 0.0 /100 | #286 | Tragic 94.5% |
| Tohono O'odham | 0.0 /100 | #287 | Tragic 94.5% |
| Malaysians | 0.0 /100 | #288 | Tragic 94.5% |
| British West Indians | 0.0 /100 | #289 | Tragic 94.4% |
| Immigrants | West Indies | 0.0 /100 | #290 | Tragic 94.3% |
| Immigrants | Grenada | 0.0 /100 | #291 | Tragic 94.3% |
| Bangladeshis | 0.0 /100 | #292 | Tragic 94.3% |
| Yaqui | 0.0 /100 | #293 | Tragic 94.2% |
| Houma | 0.0 /100 | #294 | Tragic 94.2% |
| Fijians | 0.0 /100 | #295 | Tragic 94.2% |
| Haitians | 0.0 /100 | #296 | Tragic 94.2% |
| Immigrants | South Eastern Asia | 0.0 /100 | #297 | Tragic 94.2% |