Jordanian vs Immigrants from Venezuela Vision Disability
COMPARE
Jordanian
Immigrants from Venezuela
Vision Disability
Vision Disability Comparison
Jordanians
Immigrants from Venezuela
2.0%
VISION DISABILITY
99.2/ 100
METRIC RATING
56th/ 347
METRIC RANK
2.1%
VISION DISABILITY
89.8/ 100
METRIC RATING
125th/ 347
METRIC RANK
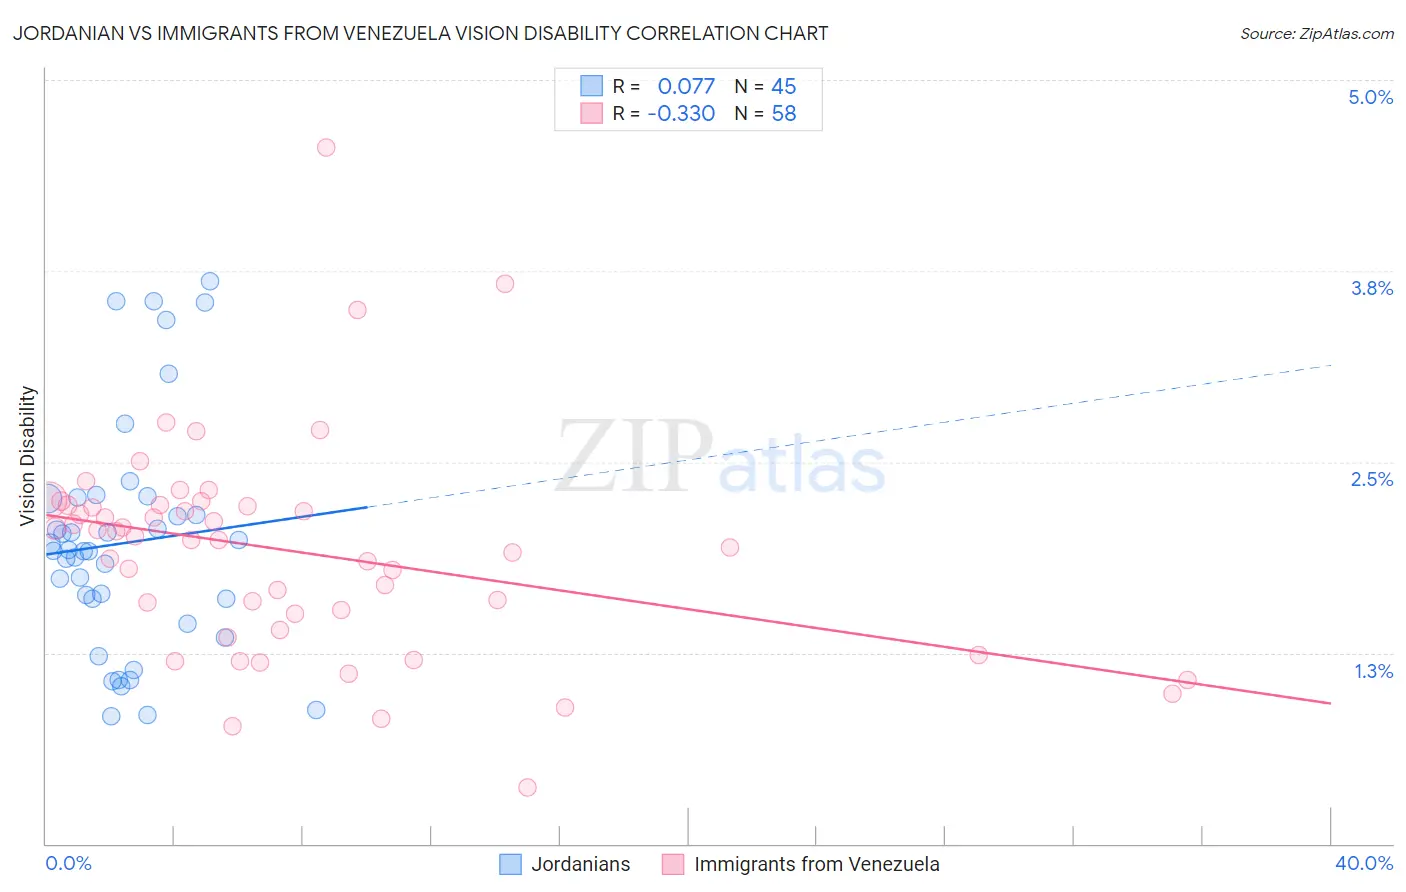
Jordanian vs Immigrants from Venezuela Vision Disability Correlation Chart
The statistical analysis conducted on geographies consisting of 166,387,634 people shows a slight positive correlation between the proportion of Jordanians and percentage of population with vision disability in the United States with a correlation coefficient (R) of 0.077 and weighted average of 2.0%. Similarly, the statistical analysis conducted on geographies consisting of 287,771,852 people shows a mild negative correlation between the proportion of Immigrants from Venezuela and percentage of population with vision disability in the United States with a correlation coefficient (R) of -0.330 and weighted average of 2.1%, a difference of 4.6%.
Vision Disability Correlation Summary
| Measurement | Jordanian | Immigrants from Venezuela |
| Minimum | 0.83% | 0.36% |
| Maximum | 3.7% | 4.6% |
| Range | 2.8% | 4.2% |
| Mean | 2.0% | 1.9% |
| Median | 1.9% | 2.0% |
| Interquartile 25% (IQ1) | 1.5% | 1.5% |
| Interquartile 75% (IQ3) | 2.3% | 2.2% |
| Interquartile Range (IQR) | 0.74% | 0.71% |
| Standard Deviation (Sample) | 0.75% | 0.71% |
| Standard Deviation (Population) | 0.74% | 0.70% |
Similar Demographics by Vision Disability
Demographics Similar to Jordanians by Vision Disability
In terms of vision disability, the demographic groups most similar to Jordanians are Somali (2.0%, a difference of 0.020%), Immigrants from Saudi Arabia (2.0%, a difference of 0.090%), Laotian (2.0%, a difference of 0.17%), Macedonian (2.0%, a difference of 0.22%), and Argentinean (2.0%, a difference of 0.23%).
| Demographics | Rating | Rank | Vision Disability |
| Latvians | 99.5 /100 | #49 | Exceptional 2.0% |
| Afghans | 99.5 /100 | #50 | Exceptional 2.0% |
| Tongans | 99.5 /100 | #51 | Exceptional 2.0% |
| Immigrants | Serbia | 99.4 /100 | #52 | Exceptional 2.0% |
| Immigrants | Belarus | 99.3 /100 | #53 | Exceptional 2.0% |
| Macedonians | 99.3 /100 | #54 | Exceptional 2.0% |
| Laotians | 99.3 /100 | #55 | Exceptional 2.0% |
| Jordanians | 99.2 /100 | #56 | Exceptional 2.0% |
| Somalis | 99.2 /100 | #57 | Exceptional 2.0% |
| Immigrants | Saudi Arabia | 99.2 /100 | #58 | Exceptional 2.0% |
| Argentineans | 99.1 /100 | #59 | Exceptional 2.0% |
| Immigrants | Romania | 99.1 /100 | #60 | Exceptional 2.0% |
| Immigrants | Belgium | 99.1 /100 | #61 | Exceptional 2.0% |
| Immigrants | Russia | 99.1 /100 | #62 | Exceptional 2.0% |
| Armenians | 99.0 /100 | #63 | Exceptional 2.0% |
Demographics Similar to Immigrants from Venezuela by Vision Disability
In terms of vision disability, the demographic groups most similar to Immigrants from Venezuela are Immigrants from Spain (2.1%, a difference of 0.0%), Immigrants from Peru (2.1%, a difference of 0.040%), Sudanese (2.1%, a difference of 0.10%), Immigrants from Ukraine (2.1%, a difference of 0.11%), and Immigrants from Albania (2.1%, a difference of 0.11%).
| Demographics | Rating | Rank | Vision Disability |
| Immigrants | Philippines | 91.4 /100 | #118 | Exceptional 2.1% |
| Immigrants | Uganda | 91.4 /100 | #119 | Exceptional 2.1% |
| Immigrants | Zimbabwe | 91.0 /100 | #120 | Exceptional 2.1% |
| Immigrants | Scotland | 90.4 /100 | #121 | Exceptional 2.1% |
| Immigrants | Ukraine | 90.4 /100 | #122 | Exceptional 2.1% |
| Immigrants | Albania | 90.4 /100 | #123 | Exceptional 2.1% |
| Immigrants | Spain | 89.8 /100 | #124 | Excellent 2.1% |
| Immigrants | Venezuela | 89.8 /100 | #125 | Excellent 2.1% |
| Immigrants | Peru | 89.5 /100 | #126 | Excellent 2.1% |
| Sudanese | 89.2 /100 | #127 | Excellent 2.1% |
| Immigrants | Chile | 89.0 /100 | #128 | Excellent 2.1% |
| Immigrants | Cameroon | 88.8 /100 | #129 | Excellent 2.1% |
| Immigrants | Kenya | 88.7 /100 | #130 | Excellent 2.1% |
| Immigrants | Hungary | 88.7 /100 | #131 | Excellent 2.1% |
| New Zealanders | 88.2 /100 | #132 | Excellent 2.1% |