Senegalese vs Immigrants from Venezuela Vision Disability
COMPARE
Senegalese
Immigrants from Venezuela
Vision Disability
Vision Disability Comparison
Senegalese
Immigrants from Venezuela
2.4%
VISION DISABILITY
0.1/ 100
METRIC RATING
268th/ 347
METRIC RANK
2.1%
VISION DISABILITY
89.8/ 100
METRIC RATING
125th/ 347
METRIC RANK
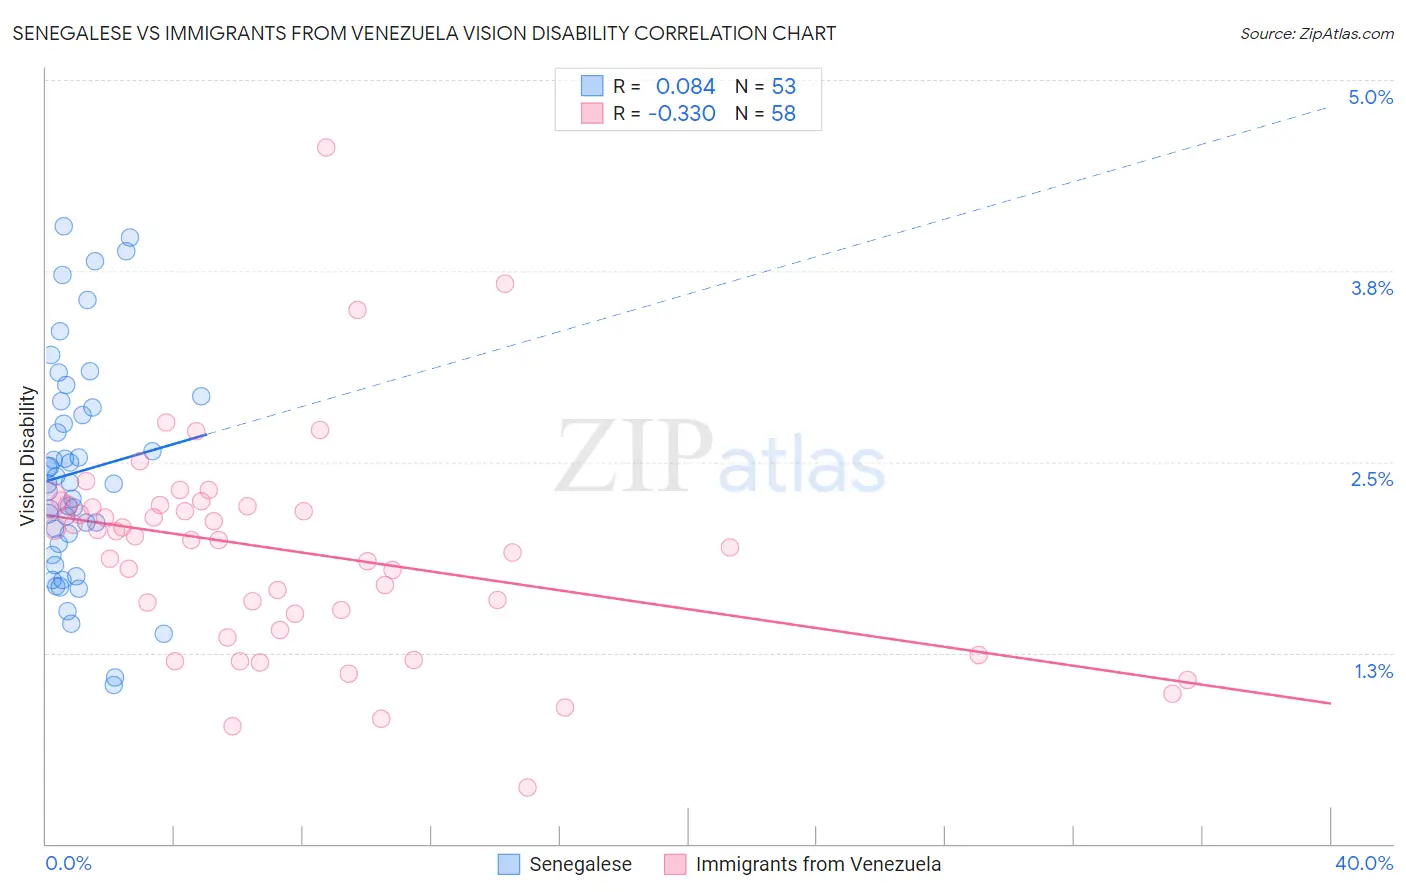
Senegalese vs Immigrants from Venezuela Vision Disability Correlation Chart
The statistical analysis conducted on geographies consisting of 78,129,878 people shows a slight positive correlation between the proportion of Senegalese and percentage of population with vision disability in the United States with a correlation coefficient (R) of 0.084 and weighted average of 2.4%. Similarly, the statistical analysis conducted on geographies consisting of 287,771,852 people shows a mild negative correlation between the proportion of Immigrants from Venezuela and percentage of population with vision disability in the United States with a correlation coefficient (R) of -0.330 and weighted average of 2.1%, a difference of 14.8%.
Vision Disability Correlation Summary
| Measurement | Senegalese | Immigrants from Venezuela |
| Minimum | 1.0% | 0.36% |
| Maximum | 4.0% | 4.6% |
| Range | 3.0% | 4.2% |
| Mean | 2.4% | 1.9% |
| Median | 2.4% | 2.0% |
| Interquartile 25% (IQ1) | 1.9% | 1.5% |
| Interquartile 75% (IQ3) | 2.9% | 2.2% |
| Interquartile Range (IQR) | 0.95% | 0.71% |
| Standard Deviation (Sample) | 0.72% | 0.71% |
| Standard Deviation (Population) | 0.72% | 0.70% |
Similar Demographics by Vision Disability
Demographics Similar to Senegalese by Vision Disability
In terms of vision disability, the demographic groups most similar to Senegalese are Ute (2.4%, a difference of 0.090%), Mexican American Indian (2.4%, a difference of 0.10%), Immigrants from Jamaica (2.4%, a difference of 0.14%), Immigrants from Liberia (2.4%, a difference of 0.16%), and Celtic (2.4%, a difference of 0.27%).
| Demographics | Rating | Rank | Vision Disability |
| Fijians | 0.1 /100 | #261 | Tragic 2.4% |
| Jamaicans | 0.1 /100 | #262 | Tragic 2.4% |
| Immigrants | Belize | 0.1 /100 | #263 | Tragic 2.4% |
| Immigrants | Liberia | 0.1 /100 | #264 | Tragic 2.4% |
| Immigrants | Jamaica | 0.1 /100 | #265 | Tragic 2.4% |
| Mexican American Indians | 0.1 /100 | #266 | Tragic 2.4% |
| Ute | 0.1 /100 | #267 | Tragic 2.4% |
| Senegalese | 0.1 /100 | #268 | Tragic 2.4% |
| Celtics | 0.1 /100 | #269 | Tragic 2.4% |
| Cubans | 0.1 /100 | #270 | Tragic 2.4% |
| Immigrants | Azores | 0.1 /100 | #271 | Tragic 2.4% |
| Spaniards | 0.1 /100 | #272 | Tragic 2.4% |
| Immigrants | Bahamas | 0.1 /100 | #273 | Tragic 2.4% |
| Immigrants | Latin America | 0.0 /100 | #274 | Tragic 2.4% |
| Chippewa | 0.0 /100 | #275 | Tragic 2.4% |
Demographics Similar to Immigrants from Venezuela by Vision Disability
In terms of vision disability, the demographic groups most similar to Immigrants from Venezuela are Immigrants from Spain (2.1%, a difference of 0.0%), Immigrants from Peru (2.1%, a difference of 0.040%), Sudanese (2.1%, a difference of 0.10%), Immigrants from Ukraine (2.1%, a difference of 0.11%), and Immigrants from Albania (2.1%, a difference of 0.11%).
| Demographics | Rating | Rank | Vision Disability |
| Immigrants | Philippines | 91.4 /100 | #118 | Exceptional 2.1% |
| Immigrants | Uganda | 91.4 /100 | #119 | Exceptional 2.1% |
| Immigrants | Zimbabwe | 91.0 /100 | #120 | Exceptional 2.1% |
| Immigrants | Scotland | 90.4 /100 | #121 | Exceptional 2.1% |
| Immigrants | Ukraine | 90.4 /100 | #122 | Exceptional 2.1% |
| Immigrants | Albania | 90.4 /100 | #123 | Exceptional 2.1% |
| Immigrants | Spain | 89.8 /100 | #124 | Excellent 2.1% |
| Immigrants | Venezuela | 89.8 /100 | #125 | Excellent 2.1% |
| Immigrants | Peru | 89.5 /100 | #126 | Excellent 2.1% |
| Sudanese | 89.2 /100 | #127 | Excellent 2.1% |
| Immigrants | Chile | 89.0 /100 | #128 | Excellent 2.1% |
| Immigrants | Cameroon | 88.8 /100 | #129 | Excellent 2.1% |
| Immigrants | Kenya | 88.7 /100 | #130 | Excellent 2.1% |
| Immigrants | Hungary | 88.7 /100 | #131 | Excellent 2.1% |
| New Zealanders | 88.2 /100 | #132 | Excellent 2.1% |