Native/Alaskan vs Immigrants from Venezuela Vision Disability
COMPARE
Native/Alaskan
Immigrants from Venezuela
Vision Disability
Vision Disability Comparison
Natives/Alaskans
Immigrants from Venezuela
3.0%
VISION DISABILITY
0.0/ 100
METRIC RATING
327th/ 347
METRIC RANK
2.1%
VISION DISABILITY
89.8/ 100
METRIC RATING
125th/ 347
METRIC RANK
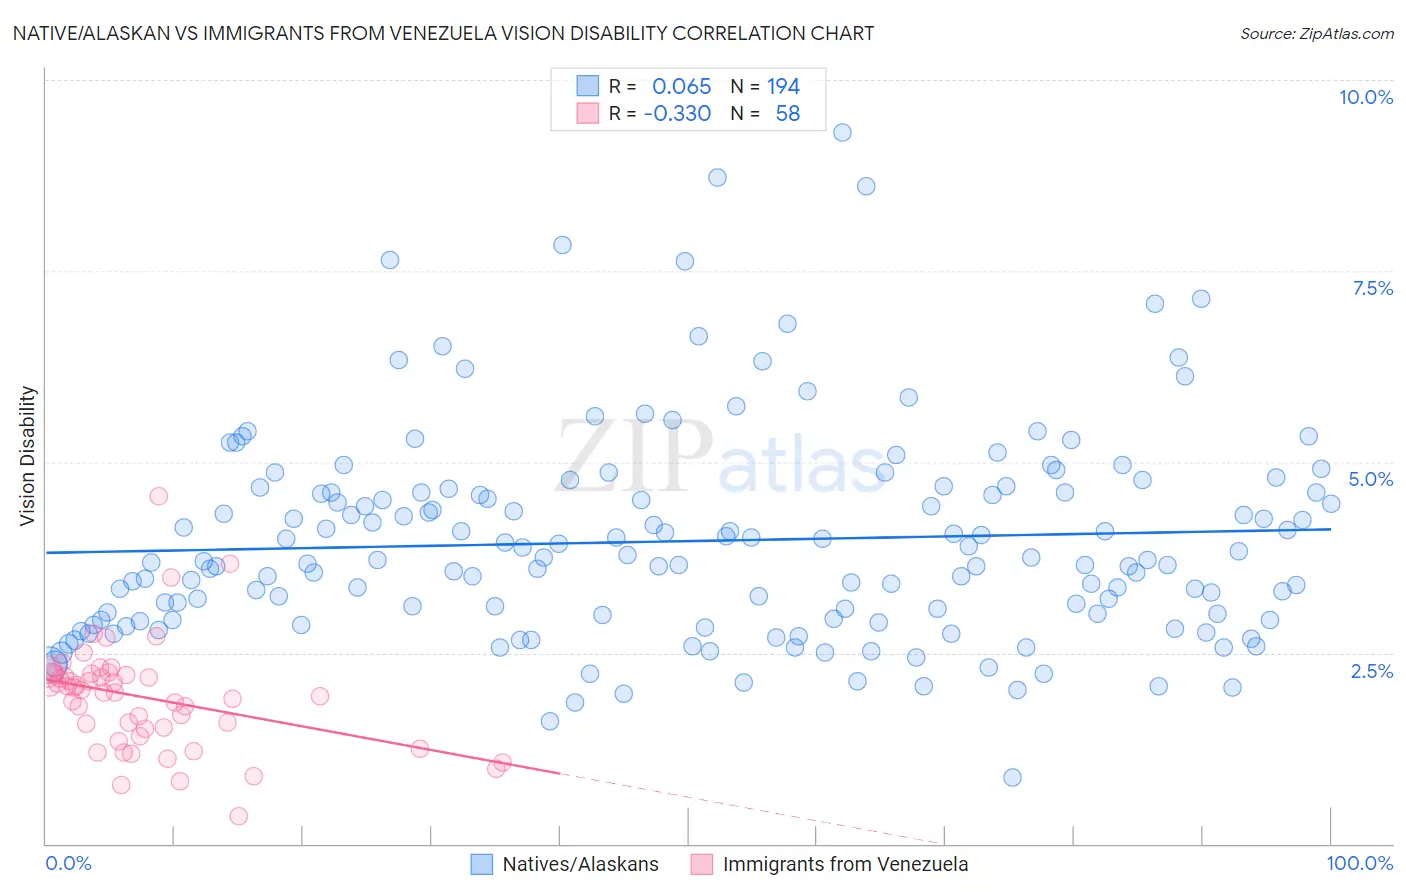
Native/Alaskan vs Immigrants from Venezuela Vision Disability Correlation Chart
The statistical analysis conducted on geographies consisting of 512,205,418 people shows a slight positive correlation between the proportion of Natives/Alaskans and percentage of population with vision disability in the United States with a correlation coefficient (R) of 0.065 and weighted average of 3.0%. Similarly, the statistical analysis conducted on geographies consisting of 287,771,852 people shows a mild negative correlation between the proportion of Immigrants from Venezuela and percentage of population with vision disability in the United States with a correlation coefficient (R) of -0.330 and weighted average of 2.1%, a difference of 41.9%.
Vision Disability Correlation Summary
| Measurement | Native/Alaskan | Immigrants from Venezuela |
| Minimum | 0.86% | 0.36% |
| Maximum | 9.3% | 4.6% |
| Range | 8.5% | 4.2% |
| Mean | 4.0% | 1.9% |
| Median | 3.7% | 2.0% |
| Interquartile 25% (IQ1) | 2.9% | 1.5% |
| Interquartile 75% (IQ3) | 4.6% | 2.2% |
| Interquartile Range (IQR) | 1.7% | 0.71% |
| Standard Deviation (Sample) | 1.4% | 0.71% |
| Standard Deviation (Population) | 1.4% | 0.70% |
Similar Demographics by Vision Disability
Demographics Similar to Natives/Alaskans by Vision Disability
In terms of vision disability, the demographic groups most similar to Natives/Alaskans are Yuman (3.0%, a difference of 0.54%), Apache (3.0%, a difference of 0.74%), Spanish American (2.9%, a difference of 0.80%), Colville (3.0%, a difference of 1.9%), and Cherokee (2.9%, a difference of 2.0%).
| Demographics | Rating | Rank | Vision Disability |
| Blacks/African Americans | 0.0 /100 | #320 | Tragic 2.8% |
| Comanche | 0.0 /100 | #321 | Tragic 2.8% |
| Paiute | 0.0 /100 | #322 | Tragic 2.9% |
| Tlingit-Haida | 0.0 /100 | #323 | Tragic 2.9% |
| Hopi | 0.0 /100 | #324 | Tragic 2.9% |
| Cherokee | 0.0 /100 | #325 | Tragic 2.9% |
| Spanish Americans | 0.0 /100 | #326 | Tragic 2.9% |
| Natives/Alaskans | 0.0 /100 | #327 | Tragic 3.0% |
| Yuman | 0.0 /100 | #328 | Tragic 3.0% |
| Apache | 0.0 /100 | #329 | Tragic 3.0% |
| Colville | 0.0 /100 | #330 | Tragic 3.0% |
| Central American Indians | 0.0 /100 | #331 | Tragic 3.0% |
| Seminole | 0.0 /100 | #332 | Tragic 3.1% |
| Cajuns | 0.0 /100 | #333 | Tragic 3.1% |
| Cheyenne | 0.0 /100 | #334 | Tragic 3.1% |
Demographics Similar to Immigrants from Venezuela by Vision Disability
In terms of vision disability, the demographic groups most similar to Immigrants from Venezuela are Immigrants from Spain (2.1%, a difference of 0.0%), Immigrants from Peru (2.1%, a difference of 0.040%), Sudanese (2.1%, a difference of 0.10%), Immigrants from Ukraine (2.1%, a difference of 0.11%), and Immigrants from Albania (2.1%, a difference of 0.11%).
| Demographics | Rating | Rank | Vision Disability |
| Immigrants | Philippines | 91.4 /100 | #118 | Exceptional 2.1% |
| Immigrants | Uganda | 91.4 /100 | #119 | Exceptional 2.1% |
| Immigrants | Zimbabwe | 91.0 /100 | #120 | Exceptional 2.1% |
| Immigrants | Scotland | 90.4 /100 | #121 | Exceptional 2.1% |
| Immigrants | Ukraine | 90.4 /100 | #122 | Exceptional 2.1% |
| Immigrants | Albania | 90.4 /100 | #123 | Exceptional 2.1% |
| Immigrants | Spain | 89.8 /100 | #124 | Excellent 2.1% |
| Immigrants | Venezuela | 89.8 /100 | #125 | Excellent 2.1% |
| Immigrants | Peru | 89.5 /100 | #126 | Excellent 2.1% |
| Sudanese | 89.2 /100 | #127 | Excellent 2.1% |
| Immigrants | Chile | 89.0 /100 | #128 | Excellent 2.1% |
| Immigrants | Cameroon | 88.8 /100 | #129 | Excellent 2.1% |
| Immigrants | Kenya | 88.7 /100 | #130 | Excellent 2.1% |
| Immigrants | Hungary | 88.7 /100 | #131 | Excellent 2.1% |
| New Zealanders | 88.2 /100 | #132 | Excellent 2.1% |