Peruvian vs Albanian Disability
COMPARE
Peruvian
Albanian
Disability
Disability Comparison
Peruvians
Albanians
10.9%
DISABILITY
99.8/ 100
METRIC RATING
51st/ 347
METRIC RANK
11.7%
DISABILITY
50.0/ 100
METRIC RATING
174th/ 347
METRIC RANK
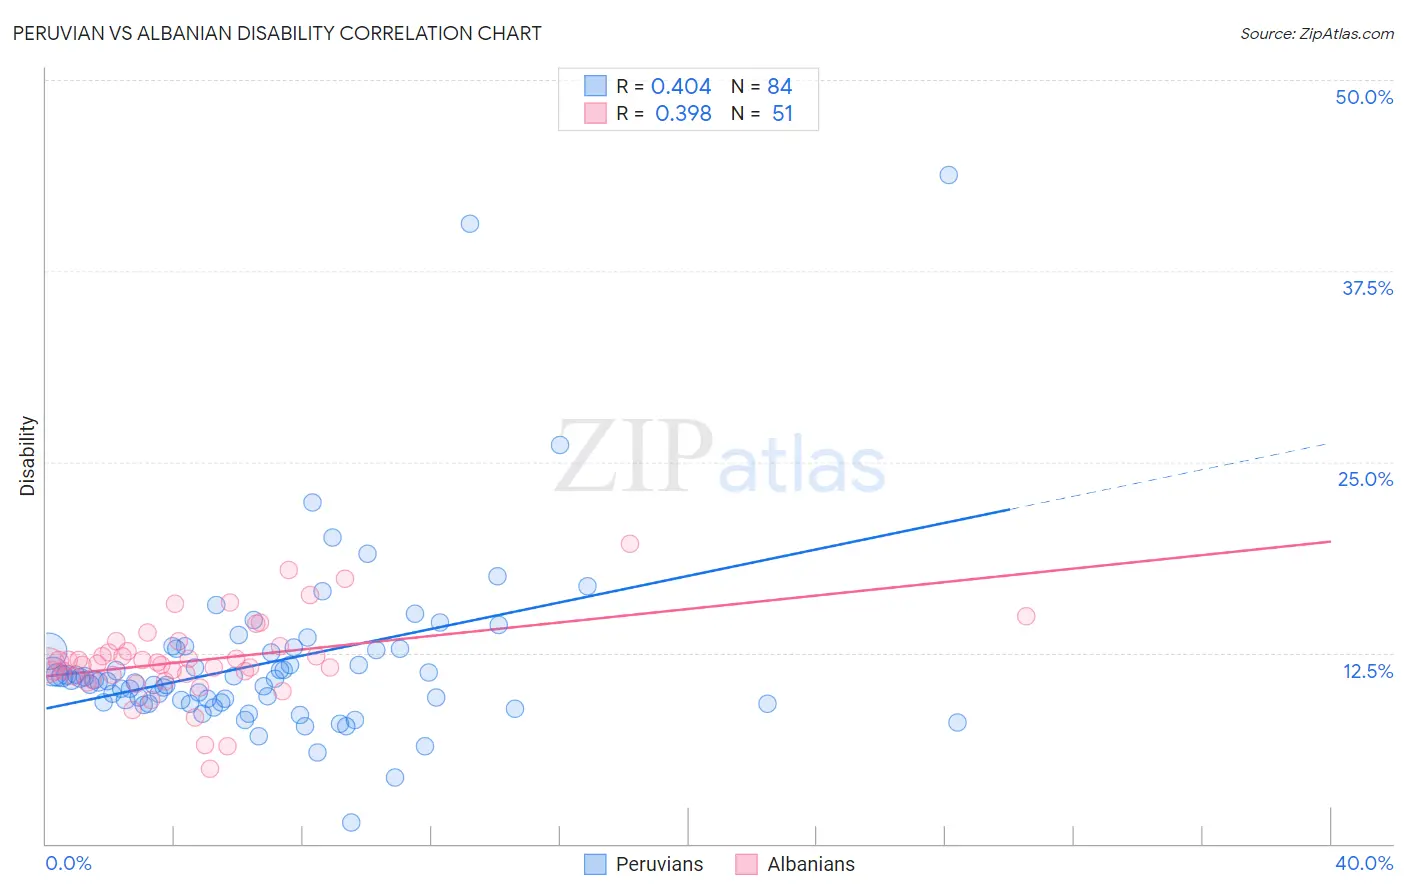
Peruvian vs Albanian Disability Correlation Chart
The statistical analysis conducted on geographies consisting of 363,197,931 people shows a moderate positive correlation between the proportion of Peruvians and percentage of population with a disability in the United States with a correlation coefficient (R) of 0.404 and weighted average of 10.9%. Similarly, the statistical analysis conducted on geographies consisting of 193,262,883 people shows a mild positive correlation between the proportion of Albanians and percentage of population with a disability in the United States with a correlation coefficient (R) of 0.398 and weighted average of 11.7%, a difference of 7.7%.
Disability Correlation Summary
| Measurement | Peruvian | Albanian |
| Minimum | 1.4% | 4.9% |
| Maximum | 43.8% | 19.7% |
| Range | 42.4% | 14.8% |
| Mean | 11.9% | 12.0% |
| Median | 10.7% | 11.7% |
| Interquartile 25% (IQ1) | 9.2% | 11.0% |
| Interquartile 75% (IQ3) | 12.7% | 12.9% |
| Interquartile Range (IQR) | 3.5% | 1.9% |
| Standard Deviation (Sample) | 6.0% | 2.7% |
| Standard Deviation (Population) | 5.9% | 2.7% |
Similar Demographics by Disability
Demographics Similar to Peruvians by Disability
In terms of disability, the demographic groups most similar to Peruvians are Vietnamese (10.9%, a difference of 0.010%), Immigrants from Saudi Arabia (10.9%, a difference of 0.010%), South American (10.9%, a difference of 0.060%), Soviet Union (10.9%, a difference of 0.070%), and Immigrants from Spain (10.9%, a difference of 0.080%).
| Demographics | Rating | Rank | Disability |
| Immigrants | Japan | 99.9 /100 | #44 | Exceptional 10.8% |
| Immigrants | Peru | 99.9 /100 | #45 | Exceptional 10.8% |
| Tongans | 99.9 /100 | #46 | Exceptional 10.8% |
| Taiwanese | 99.9 /100 | #47 | Exceptional 10.8% |
| Soviet Union | 99.9 /100 | #48 | Exceptional 10.9% |
| Vietnamese | 99.9 /100 | #49 | Exceptional 10.9% |
| Immigrants | Saudi Arabia | 99.9 /100 | #50 | Exceptional 10.9% |
| Peruvians | 99.8 /100 | #51 | Exceptional 10.9% |
| South Americans | 99.8 /100 | #52 | Exceptional 10.9% |
| Immigrants | Spain | 99.8 /100 | #53 | Exceptional 10.9% |
| Jordanians | 99.8 /100 | #54 | Exceptional 10.9% |
| Immigrants | El Salvador | 99.8 /100 | #55 | Exceptional 10.9% |
| Immigrants | Lithuania | 99.8 /100 | #56 | Exceptional 10.9% |
| Salvadorans | 99.8 /100 | #57 | Exceptional 10.9% |
| Immigrants | South America | 99.8 /100 | #58 | Exceptional 10.9% |
Demographics Similar to Albanians by Disability
In terms of disability, the demographic groups most similar to Albanians are Maltese (11.7%, a difference of 0.030%), Haitian (11.7%, a difference of 0.060%), Immigrants from Western Africa (11.7%, a difference of 0.11%), Immigrants from Albania (11.7%, a difference of 0.12%), and Immigrants from Southern Europe (11.7%, a difference of 0.12%).
| Demographics | Rating | Rank | Disability |
| Estonians | 54.4 /100 | #167 | Average 11.7% |
| Immigrants | Latin America | 54.1 /100 | #168 | Average 11.7% |
| Immigrants | Austria | 53.4 /100 | #169 | Average 11.7% |
| Immigrants | Albania | 52.8 /100 | #170 | Average 11.7% |
| Immigrants | Southern Europe | 52.8 /100 | #171 | Average 11.7% |
| Trinidadians and Tobagonians | 52.7 /100 | #172 | Average 11.7% |
| Maltese | 50.6 /100 | #173 | Average 11.7% |
| Albanians | 50.0 /100 | #174 | Average 11.7% |
| Haitians | 48.6 /100 | #175 | Average 11.7% |
| Immigrants | Western Africa | 47.5 /100 | #176 | Average 11.7% |
| Immigrants | Central America | 46.6 /100 | #177 | Average 11.7% |
| Greeks | 46.2 /100 | #178 | Average 11.7% |
| Immigrants | Armenia | 41.9 /100 | #179 | Average 11.7% |
| Immigrants | Honduras | 37.8 /100 | #180 | Fair 11.8% |
| Immigrants | Oceania | 34.3 /100 | #181 | Fair 11.8% |