Peruvian vs Senegalese Ambulatory Disability
COMPARE
Peruvian
Senegalese
Ambulatory Disability
Ambulatory Disability Comparison
Peruvians
Senegalese
5.7%
AMBULATORY DISABILITY
99.5/ 100
METRIC RATING
69th/ 347
METRIC RANK
6.4%
AMBULATORY DISABILITY
1.7/ 100
METRIC RATING
239th/ 347
METRIC RANK
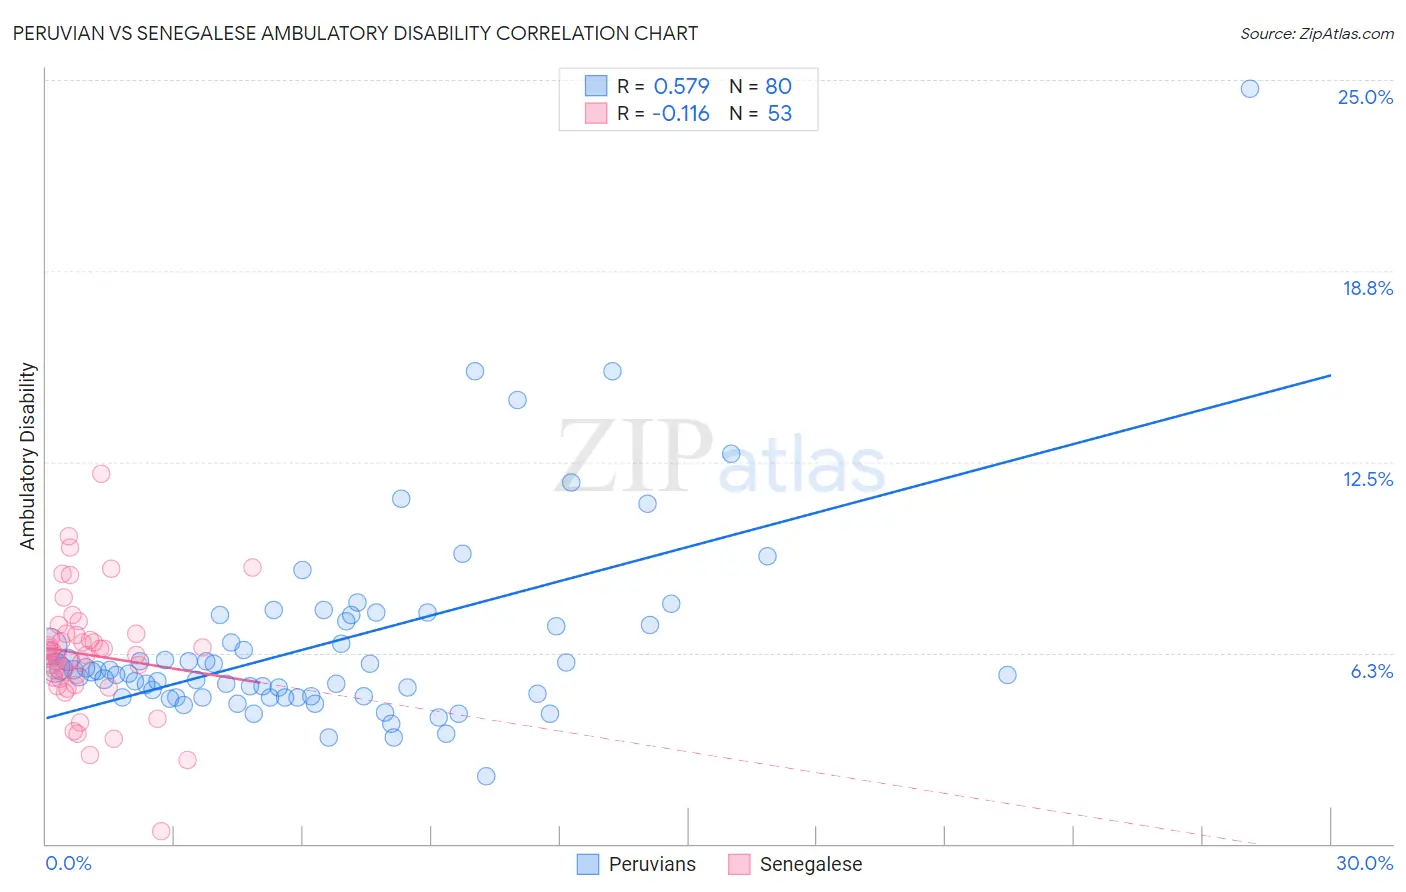
Peruvian vs Senegalese Ambulatory Disability Correlation Chart
The statistical analysis conducted on geographies consisting of 363,114,873 people shows a substantial positive correlation between the proportion of Peruvians and percentage of population with ambulatory disability in the United States with a correlation coefficient (R) of 0.579 and weighted average of 5.7%. Similarly, the statistical analysis conducted on geographies consisting of 78,138,068 people shows a poor negative correlation between the proportion of Senegalese and percentage of population with ambulatory disability in the United States with a correlation coefficient (R) of -0.116 and weighted average of 6.4%, a difference of 13.3%.
Ambulatory Disability Correlation Summary
| Measurement | Peruvian | Senegalese |
| Minimum | 2.2% | 0.40% |
| Maximum | 24.7% | 12.1% |
| Range | 22.5% | 11.7% |
| Mean | 6.6% | 6.2% |
| Median | 5.7% | 6.2% |
| Interquartile 25% (IQ1) | 4.8% | 5.3% |
| Interquartile 75% (IQ3) | 7.2% | 6.8% |
| Interquartile Range (IQR) | 2.4% | 1.5% |
| Standard Deviation (Sample) | 3.3% | 1.9% |
| Standard Deviation (Population) | 3.3% | 1.9% |
Similar Demographics by Ambulatory Disability
Demographics Similar to Peruvians by Ambulatory Disability
In terms of ambulatory disability, the demographic groups most similar to Peruvians are Sierra Leonean (5.7%, a difference of 0.23%), Immigrants from Peru (5.7%, a difference of 0.32%), Brazilian (5.7%, a difference of 0.34%), Immigrants from Northern Africa (5.7%, a difference of 0.36%), and Immigrants from Cameroon (5.7%, a difference of 0.36%).
| Demographics | Rating | Rank | Ambulatory Disability |
| Immigrants | Spain | 99.7 /100 | #62 | Exceptional 5.6% |
| Immigrants | France | 99.7 /100 | #63 | Exceptional 5.6% |
| Laotians | 99.7 /100 | #64 | Exceptional 5.7% |
| Immigrants | Switzerland | 99.7 /100 | #65 | Exceptional 5.7% |
| Israelis | 99.6 /100 | #66 | Exceptional 5.7% |
| Immigrants | Uganda | 99.6 /100 | #67 | Exceptional 5.7% |
| Sri Lankans | 99.6 /100 | #68 | Exceptional 5.7% |
| Peruvians | 99.5 /100 | #69 | Exceptional 5.7% |
| Sierra Leoneans | 99.4 /100 | #70 | Exceptional 5.7% |
| Immigrants | Peru | 99.4 /100 | #71 | Exceptional 5.7% |
| Brazilians | 99.4 /100 | #72 | Exceptional 5.7% |
| Immigrants | Northern Africa | 99.4 /100 | #73 | Exceptional 5.7% |
| Immigrants | Cameroon | 99.4 /100 | #74 | Exceptional 5.7% |
| Immigrants | South Africa | 99.3 /100 | #75 | Exceptional 5.7% |
| Sudanese | 99.3 /100 | #76 | Exceptional 5.7% |
Demographics Similar to Senegalese by Ambulatory Disability
In terms of ambulatory disability, the demographic groups most similar to Senegalese are Immigrants from Senegal (6.4%, a difference of 0.030%), Haitian (6.4%, a difference of 0.070%), Immigrants from Germany (6.4%, a difference of 0.080%), Immigrants from Haiti (6.5%, a difference of 0.11%), and Spaniard (6.5%, a difference of 0.14%).
| Demographics | Rating | Rank | Ambulatory Disability |
| Assyrians/Chaldeans/Syriacs | 2.4 /100 | #232 | Tragic 6.4% |
| Sub-Saharan Africans | 2.3 /100 | #233 | Tragic 6.4% |
| Immigrants | Liberia | 2.3 /100 | #234 | Tragic 6.4% |
| Hispanics or Latinos | 2.2 /100 | #235 | Tragic 6.4% |
| Dutch | 2.0 /100 | #236 | Tragic 6.4% |
| Immigrants | Germany | 1.8 /100 | #237 | Tragic 6.4% |
| Haitians | 1.8 /100 | #238 | Tragic 6.4% |
| Senegalese | 1.7 /100 | #239 | Tragic 6.4% |
| Immigrants | Senegal | 1.7 /100 | #240 | Tragic 6.4% |
| Immigrants | Haiti | 1.6 /100 | #241 | Tragic 6.5% |
| Spaniards | 1.6 /100 | #242 | Tragic 6.5% |
| Germans | 1.5 /100 | #243 | Tragic 6.5% |
| Immigrants | Panama | 1.5 /100 | #244 | Tragic 6.5% |
| Tlingit-Haida | 1.5 /100 | #245 | Tragic 6.5% |
| Armenians | 1.5 /100 | #246 | Tragic 6.5% |