Peruvian vs Canadian Ambulatory Disability
COMPARE
Peruvian
Canadian
Ambulatory Disability
Ambulatory Disability Comparison
Peruvians
Canadians
5.7%
AMBULATORY DISABILITY
99.5/ 100
METRIC RATING
69th/ 347
METRIC RANK
6.3%
AMBULATORY DISABILITY
10.9/ 100
METRIC RATING
216th/ 347
METRIC RANK
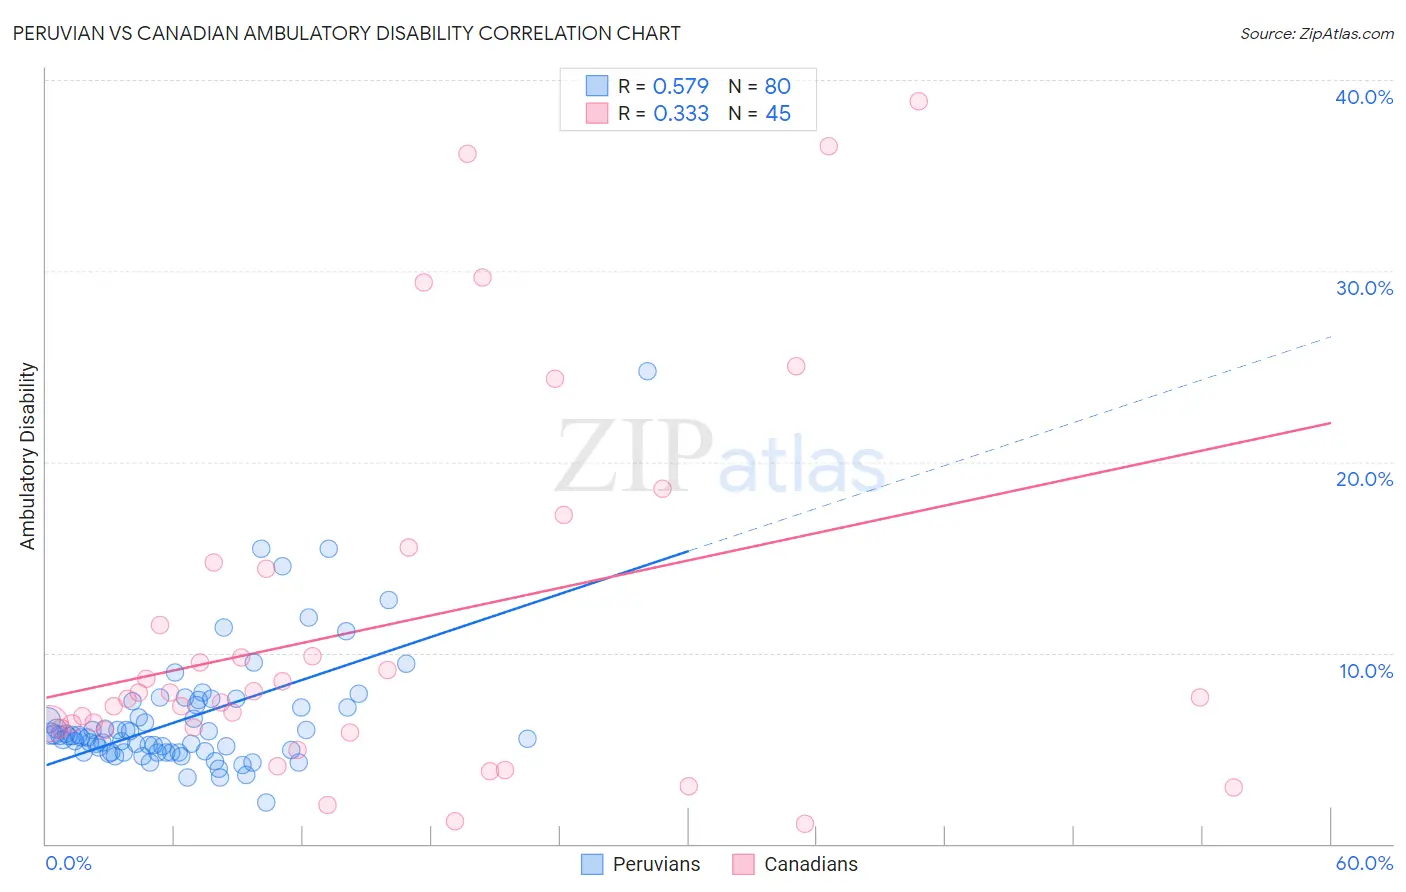
Peruvian vs Canadian Ambulatory Disability Correlation Chart
The statistical analysis conducted on geographies consisting of 363,114,873 people shows a substantial positive correlation between the proportion of Peruvians and percentage of population with ambulatory disability in the United States with a correlation coefficient (R) of 0.579 and weighted average of 5.7%. Similarly, the statistical analysis conducted on geographies consisting of 437,391,973 people shows a mild positive correlation between the proportion of Canadians and percentage of population with ambulatory disability in the United States with a correlation coefficient (R) of 0.333 and weighted average of 6.3%, a difference of 10.6%.
Ambulatory Disability Correlation Summary
| Measurement | Peruvian | Canadian |
| Minimum | 2.2% | 1.0% |
| Maximum | 24.7% | 38.9% |
| Range | 22.5% | 37.8% |
| Mean | 6.6% | 11.4% |
| Median | 5.7% | 7.7% |
| Interquartile 25% (IQ1) | 4.8% | 6.0% |
| Interquartile 75% (IQ3) | 7.2% | 14.6% |
| Interquartile Range (IQR) | 2.4% | 8.6% |
| Standard Deviation (Sample) | 3.3% | 9.7% |
| Standard Deviation (Population) | 3.3% | 9.6% |
Similar Demographics by Ambulatory Disability
Demographics Similar to Peruvians by Ambulatory Disability
In terms of ambulatory disability, the demographic groups most similar to Peruvians are Sierra Leonean (5.7%, a difference of 0.23%), Immigrants from Peru (5.7%, a difference of 0.32%), Brazilian (5.7%, a difference of 0.34%), Immigrants from Northern Africa (5.7%, a difference of 0.36%), and Immigrants from Cameroon (5.7%, a difference of 0.36%).
| Demographics | Rating | Rank | Ambulatory Disability |
| Immigrants | Spain | 99.7 /100 | #62 | Exceptional 5.6% |
| Immigrants | France | 99.7 /100 | #63 | Exceptional 5.6% |
| Laotians | 99.7 /100 | #64 | Exceptional 5.7% |
| Immigrants | Switzerland | 99.7 /100 | #65 | Exceptional 5.7% |
| Israelis | 99.6 /100 | #66 | Exceptional 5.7% |
| Immigrants | Uganda | 99.6 /100 | #67 | Exceptional 5.7% |
| Sri Lankans | 99.6 /100 | #68 | Exceptional 5.7% |
| Peruvians | 99.5 /100 | #69 | Exceptional 5.7% |
| Sierra Leoneans | 99.4 /100 | #70 | Exceptional 5.7% |
| Immigrants | Peru | 99.4 /100 | #71 | Exceptional 5.7% |
| Brazilians | 99.4 /100 | #72 | Exceptional 5.7% |
| Immigrants | Northern Africa | 99.4 /100 | #73 | Exceptional 5.7% |
| Immigrants | Cameroon | 99.4 /100 | #74 | Exceptional 5.7% |
| Immigrants | South Africa | 99.3 /100 | #75 | Exceptional 5.7% |
| Sudanese | 99.3 /100 | #76 | Exceptional 5.7% |
Demographics Similar to Canadians by Ambulatory Disability
In terms of ambulatory disability, the demographic groups most similar to Canadians are Yugoslavian (6.3%, a difference of 0.0%), Immigrants from Latin America (6.3%, a difference of 0.010%), Immigrants from Mexico (6.3%, a difference of 0.020%), Guamanian/Chamorro (6.3%, a difference of 0.040%), and Mexican American Indian (6.3%, a difference of 0.14%).
| Demographics | Rating | Rank | Ambulatory Disability |
| Immigrants | Iraq | 14.0 /100 | #209 | Poor 6.3% |
| Immigrants | Laos | 13.2 /100 | #210 | Poor 6.3% |
| Samoans | 12.1 /100 | #211 | Poor 6.3% |
| Mexican American Indians | 12.0 /100 | #212 | Poor 6.3% |
| Japanese | 12.0 /100 | #213 | Poor 6.3% |
| Immigrants | Mexico | 11.0 /100 | #214 | Poor 6.3% |
| Immigrants | Latin America | 11.0 /100 | #215 | Poor 6.3% |
| Canadians | 10.9 /100 | #216 | Poor 6.3% |
| Yugoslavians | 10.9 /100 | #217 | Poor 6.3% |
| Guamanians/Chamorros | 10.6 /100 | #218 | Poor 6.3% |
| Indonesians | 9.9 /100 | #219 | Tragic 6.3% |
| Immigrants | Albania | 9.6 /100 | #220 | Tragic 6.3% |
| Hungarians | 9.6 /100 | #221 | Tragic 6.3% |
| German Russians | 9.4 /100 | #222 | Tragic 6.3% |
| Immigrants | Honduras | 7.6 /100 | #223 | Tragic 6.3% |