Immigrants from Sweden vs Immigrants from Philippines Self-Care Disability
COMPARE
Immigrants from Sweden
Immigrants from Philippines
Self-Care Disability
Self-Care Disability Comparison
Immigrants from Sweden
Immigrants from Philippines
2.3%
SELF-CARE DISABILITY
99.9/ 100
METRIC RATING
37th/ 347
METRIC RANK
2.6%
SELF-CARE DISABILITY
2.7/ 100
METRIC RATING
227th/ 347
METRIC RANK
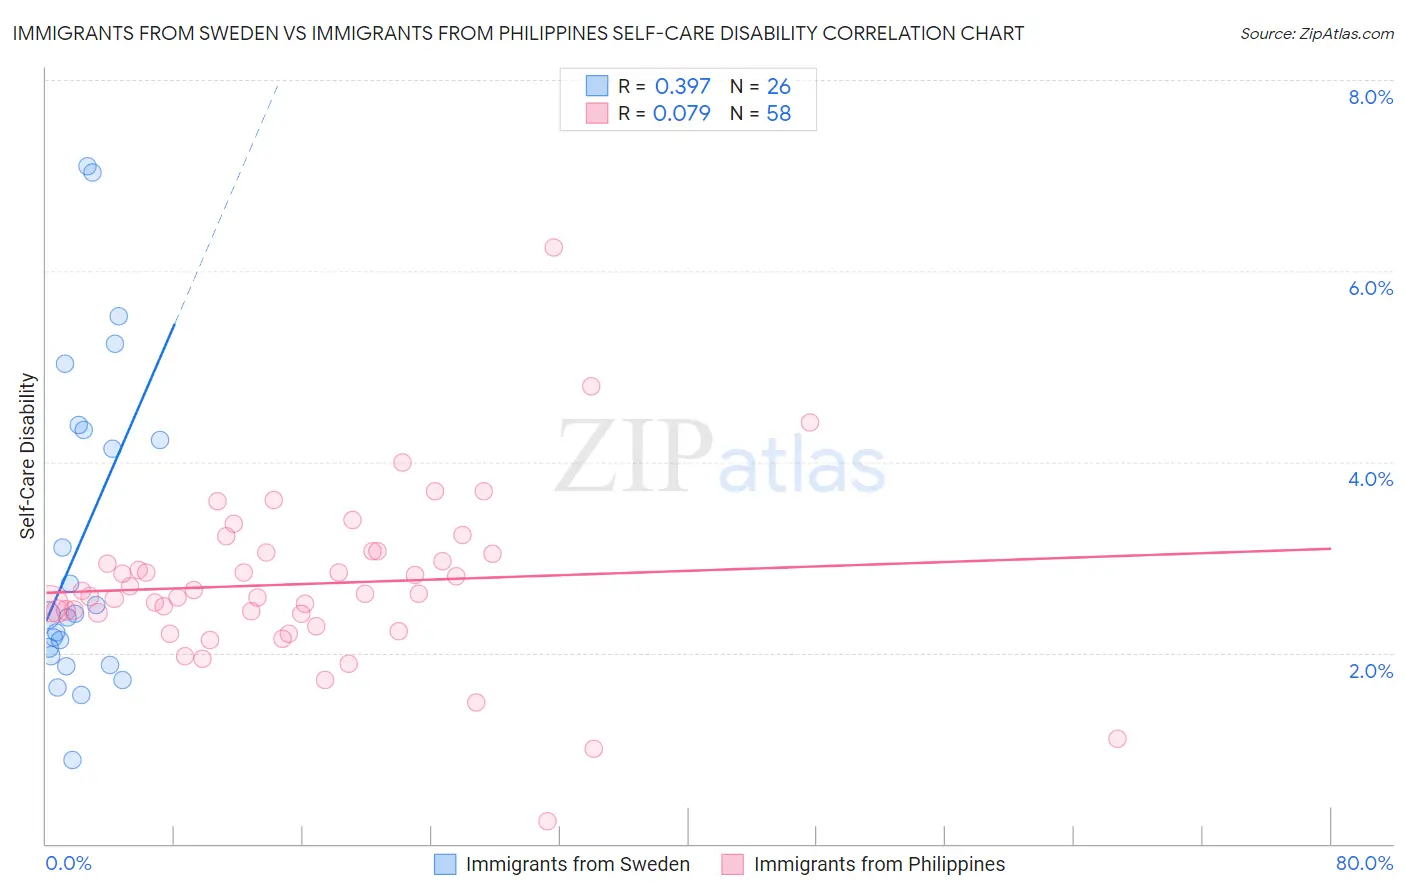
Immigrants from Sweden vs Immigrants from Philippines Self-Care Disability Correlation Chart
The statistical analysis conducted on geographies consisting of 164,653,389 people shows a mild positive correlation between the proportion of Immigrants from Sweden and percentage of population with self-care disability in the United States with a correlation coefficient (R) of 0.397 and weighted average of 2.3%. Similarly, the statistical analysis conducted on geographies consisting of 470,541,015 people shows a slight positive correlation between the proportion of Immigrants from Philippines and percentage of population with self-care disability in the United States with a correlation coefficient (R) of 0.079 and weighted average of 2.6%, a difference of 13.2%.
Self-Care Disability Correlation Summary
| Measurement | Immigrants from Sweden | Immigrants from Philippines |
| Minimum | 0.87% | 0.24% |
| Maximum | 7.1% | 6.2% |
| Range | 6.2% | 6.0% |
| Mean | 3.2% | 2.7% |
| Median | 2.4% | 2.6% |
| Interquartile 25% (IQ1) | 2.0% | 2.4% |
| Interquartile 75% (IQ3) | 4.3% | 3.0% |
| Interquartile Range (IQR) | 2.4% | 0.64% |
| Standard Deviation (Sample) | 1.7% | 0.89% |
| Standard Deviation (Population) | 1.7% | 0.88% |
Similar Demographics by Self-Care Disability
Demographics Similar to Immigrants from Sweden by Self-Care Disability
In terms of self-care disability, the demographic groups most similar to Immigrants from Sweden are Immigrants from Eastern Africa (2.3%, a difference of 0.13%), Immigrants from Lithuania (2.3%, a difference of 0.17%), Immigrants from Australia (2.3%, a difference of 0.18%), Immigrants from Bulgaria (2.3%, a difference of 0.23%), and Immigrants from Turkey (2.3%, a difference of 0.24%).
| Demographics | Rating | Rank | Self-Care Disability |
| Paraguayans | 99.9 /100 | #30 | Exceptional 2.3% |
| Danes | 99.9 /100 | #31 | Exceptional 2.3% |
| Burmese | 99.9 /100 | #32 | Exceptional 2.3% |
| Immigrants | Korea | 99.9 /100 | #33 | Exceptional 2.3% |
| Immigrants | Turkey | 99.9 /100 | #34 | Exceptional 2.3% |
| Immigrants | Australia | 99.9 /100 | #35 | Exceptional 2.3% |
| Immigrants | Lithuania | 99.9 /100 | #36 | Exceptional 2.3% |
| Immigrants | Sweden | 99.9 /100 | #37 | Exceptional 2.3% |
| Immigrants | Eastern Africa | 99.9 /100 | #38 | Exceptional 2.3% |
| Immigrants | Bulgaria | 99.8 /100 | #39 | Exceptional 2.3% |
| Iranians | 99.8 /100 | #40 | Exceptional 2.3% |
| Immigrants | Sudan | 99.8 /100 | #41 | Exceptional 2.3% |
| Immigrants | Uganda | 99.8 /100 | #42 | Exceptional 2.3% |
| Immigrants | Pakistan | 99.8 /100 | #43 | Exceptional 2.3% |
| Immigrants | South Africa | 99.8 /100 | #44 | Exceptional 2.3% |
Demographics Similar to Immigrants from Philippines by Self-Care Disability
In terms of self-care disability, the demographic groups most similar to Immigrants from Philippines are Guatemalan (2.6%, a difference of 0.010%), Chinese (2.6%, a difference of 0.080%), Guamanian/Chamorro (2.6%, a difference of 0.080%), Immigrants from Ecuador (2.6%, a difference of 0.080%), and Iraqi (2.6%, a difference of 0.18%).
| Demographics | Rating | Rank | Self-Care Disability |
| Sub-Saharan Africans | 4.0 /100 | #220 | Tragic 2.6% |
| Hondurans | 3.8 /100 | #221 | Tragic 2.6% |
| Spaniards | 3.8 /100 | #222 | Tragic 2.6% |
| French Canadians | 3.8 /100 | #223 | Tragic 2.6% |
| Osage | 3.6 /100 | #224 | Tragic 2.6% |
| Iraqis | 3.2 /100 | #225 | Tragic 2.6% |
| Chinese | 2.9 /100 | #226 | Tragic 2.6% |
| Immigrants | Philippines | 2.7 /100 | #227 | Tragic 2.6% |
| Guatemalans | 2.7 /100 | #228 | Tragic 2.6% |
| Guamanians/Chamorros | 2.5 /100 | #229 | Tragic 2.6% |
| Immigrants | Ecuador | 2.5 /100 | #230 | Tragic 2.6% |
| Immigrants | Guatemala | 2.2 /100 | #231 | Tragic 2.6% |
| Albanians | 2.2 /100 | #232 | Tragic 2.6% |
| Liberians | 2.1 /100 | #233 | Tragic 2.6% |
| Vietnamese | 2.1 /100 | #234 | Tragic 2.6% |