Comanche vs Immigrants from Philippines Self-Care Disability
COMPARE
Comanche
Immigrants from Philippines
Self-Care Disability
Self-Care Disability Comparison
Comanche
Immigrants from Philippines
2.9%
SELF-CARE DISABILITY
0.0/ 100
METRIC RATING
322nd/ 347
METRIC RANK
2.6%
SELF-CARE DISABILITY
2.7/ 100
METRIC RATING
227th/ 347
METRIC RANK
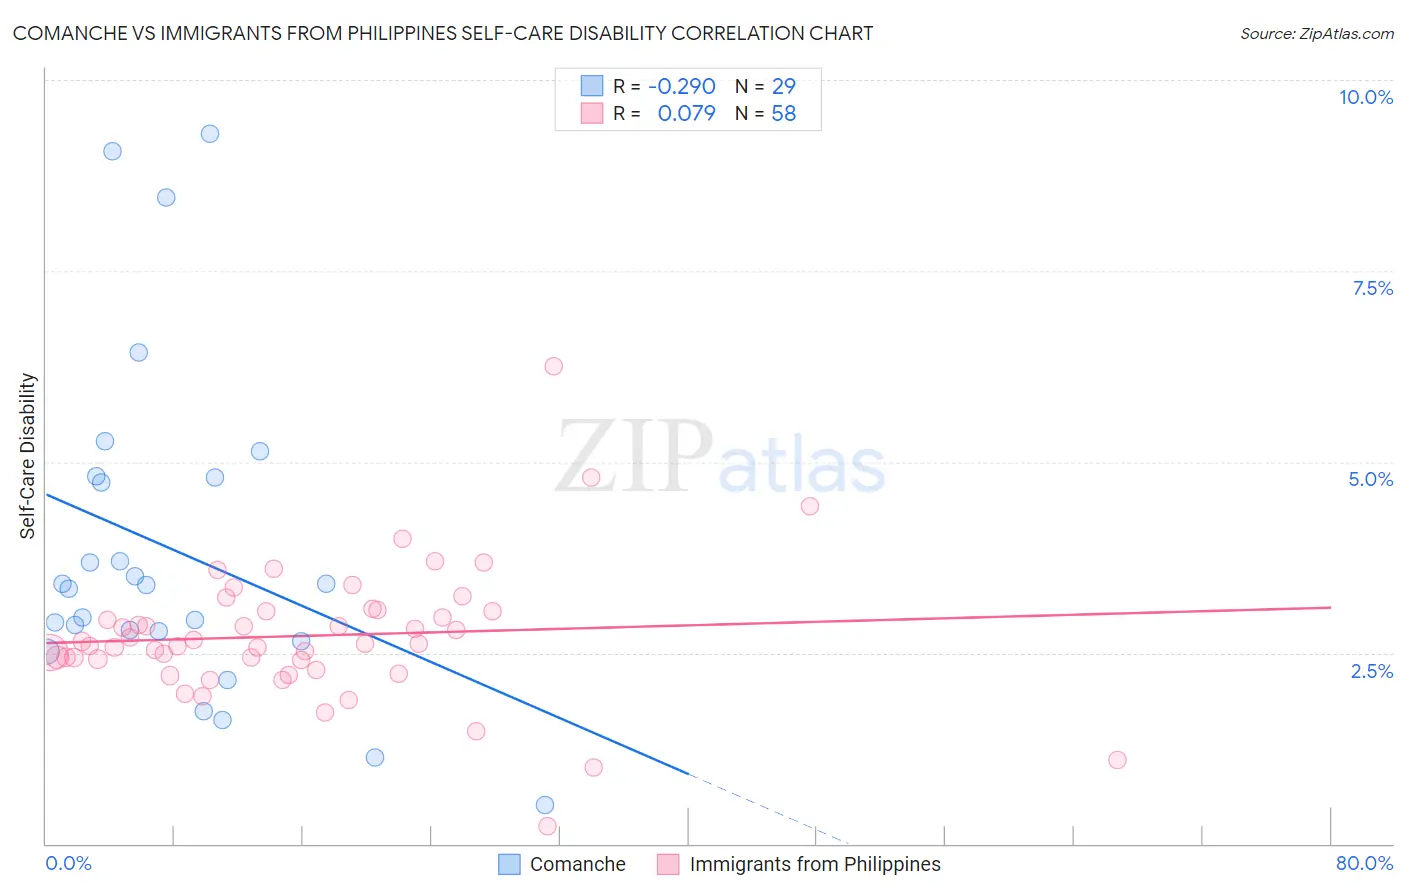
Comanche vs Immigrants from Philippines Self-Care Disability Correlation Chart
The statistical analysis conducted on geographies consisting of 109,703,809 people shows a weak negative correlation between the proportion of Comanche and percentage of population with self-care disability in the United States with a correlation coefficient (R) of -0.290 and weighted average of 2.9%. Similarly, the statistical analysis conducted on geographies consisting of 470,541,015 people shows a slight positive correlation between the proportion of Immigrants from Philippines and percentage of population with self-care disability in the United States with a correlation coefficient (R) of 0.079 and weighted average of 2.6%, a difference of 11.7%.
Self-Care Disability Correlation Summary
| Measurement | Comanche | Immigrants from Philippines |
| Minimum | 0.50% | 0.24% |
| Maximum | 9.3% | 6.2% |
| Range | 8.8% | 6.0% |
| Mean | 3.9% | 2.7% |
| Median | 3.4% | 2.6% |
| Interquartile 25% (IQ1) | 2.7% | 2.4% |
| Interquartile 75% (IQ3) | 4.8% | 3.0% |
| Interquartile Range (IQR) | 2.1% | 0.64% |
| Standard Deviation (Sample) | 2.2% | 0.89% |
| Standard Deviation (Population) | 2.1% | 0.88% |
Similar Demographics by Self-Care Disability
Demographics Similar to Comanche by Self-Care Disability
In terms of self-care disability, the demographic groups most similar to Comanche are Seminole (2.9%, a difference of 0.12%), Cherokee (2.9%, a difference of 0.22%), Navajo (2.9%, a difference of 0.32%), Chickasaw (2.9%, a difference of 0.47%), and Spanish American Indian (2.9%, a difference of 0.69%).
| Demographics | Rating | Rank | Self-Care Disability |
| Immigrants | Cuba | 0.0 /100 | #315 | Tragic 2.8% |
| Menominee | 0.0 /100 | #316 | Tragic 2.8% |
| Immigrants | Dominica | 0.0 /100 | #317 | Tragic 2.8% |
| Assyrians/Chaldeans/Syriacs | 0.0 /100 | #318 | Tragic 2.8% |
| Spanish American Indians | 0.0 /100 | #319 | Tragic 2.9% |
| Chickasaw | 0.0 /100 | #320 | Tragic 2.9% |
| Navajo | 0.0 /100 | #321 | Tragic 2.9% |
| Comanche | 0.0 /100 | #322 | Tragic 2.9% |
| Seminole | 0.0 /100 | #323 | Tragic 2.9% |
| Cherokee | 0.0 /100 | #324 | Tragic 2.9% |
| Immigrants | Uzbekistan | 0.0 /100 | #325 | Tragic 2.9% |
| Paiute | 0.0 /100 | #326 | Tragic 2.9% |
| Blacks/African Americans | 0.0 /100 | #327 | Tragic 2.9% |
| Hopi | 0.0 /100 | #328 | Tragic 2.9% |
| Cajuns | 0.0 /100 | #329 | Tragic 2.9% |
Demographics Similar to Immigrants from Philippines by Self-Care Disability
In terms of self-care disability, the demographic groups most similar to Immigrants from Philippines are Guatemalan (2.6%, a difference of 0.010%), Chinese (2.6%, a difference of 0.080%), Guamanian/Chamorro (2.6%, a difference of 0.080%), Immigrants from Ecuador (2.6%, a difference of 0.080%), and Iraqi (2.6%, a difference of 0.18%).
| Demographics | Rating | Rank | Self-Care Disability |
| Sub-Saharan Africans | 4.0 /100 | #220 | Tragic 2.6% |
| Hondurans | 3.8 /100 | #221 | Tragic 2.6% |
| Spaniards | 3.8 /100 | #222 | Tragic 2.6% |
| French Canadians | 3.8 /100 | #223 | Tragic 2.6% |
| Osage | 3.6 /100 | #224 | Tragic 2.6% |
| Iraqis | 3.2 /100 | #225 | Tragic 2.6% |
| Chinese | 2.9 /100 | #226 | Tragic 2.6% |
| Immigrants | Philippines | 2.7 /100 | #227 | Tragic 2.6% |
| Guatemalans | 2.7 /100 | #228 | Tragic 2.6% |
| Guamanians/Chamorros | 2.5 /100 | #229 | Tragic 2.6% |
| Immigrants | Ecuador | 2.5 /100 | #230 | Tragic 2.6% |
| Immigrants | Guatemala | 2.2 /100 | #231 | Tragic 2.6% |
| Albanians | 2.2 /100 | #232 | Tragic 2.6% |
| Liberians | 2.1 /100 | #233 | Tragic 2.6% |
| Vietnamese | 2.1 /100 | #234 | Tragic 2.6% |