Paraguayan vs Somali Vision Disability
COMPARE
Paraguayan
Somali
Vision Disability
Vision Disability Comparison
Paraguayans
Somalis
2.0%
VISION DISABILITY
98.3/ 100
METRIC RATING
76th/ 347
METRIC RANK
2.0%
VISION DISABILITY
99.2/ 100
METRIC RATING
57th/ 347
METRIC RANK
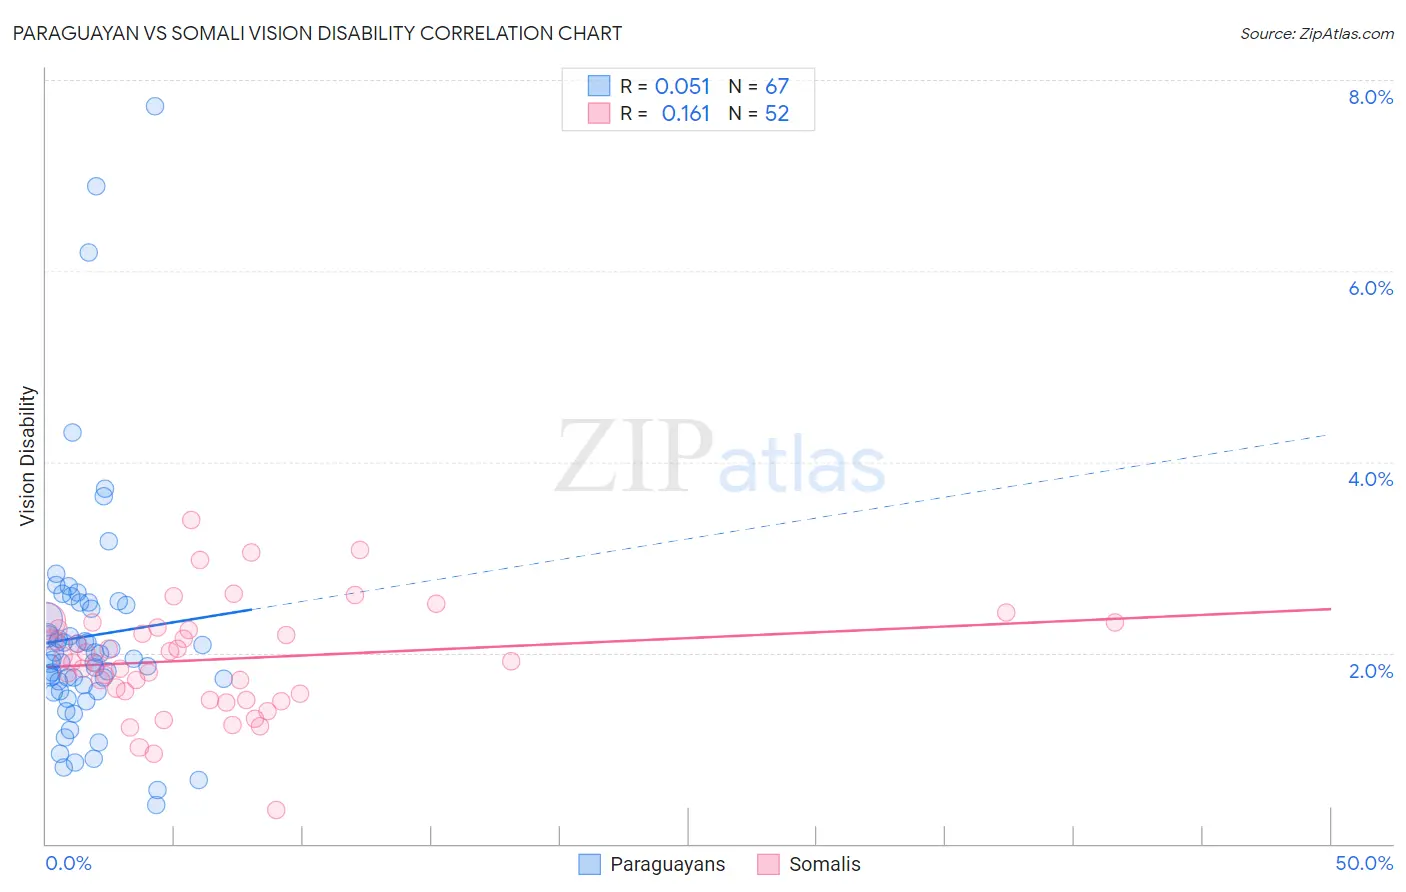
Paraguayan vs Somali Vision Disability Correlation Chart
The statistical analysis conducted on geographies consisting of 95,099,644 people shows a slight positive correlation between the proportion of Paraguayans and percentage of population with vision disability in the United States with a correlation coefficient (R) of 0.051 and weighted average of 2.0%. Similarly, the statistical analysis conducted on geographies consisting of 99,264,123 people shows a poor positive correlation between the proportion of Somalis and percentage of population with vision disability in the United States with a correlation coefficient (R) of 0.161 and weighted average of 2.0%, a difference of 1.4%.
Vision Disability Correlation Summary
| Measurement | Paraguayan | Somali |
| Minimum | 0.41% | 0.35% |
| Maximum | 7.7% | 3.4% |
| Range | 7.3% | 3.0% |
| Mean | 2.2% | 1.9% |
| Median | 1.9% | 1.9% |
| Interquartile 25% (IQ1) | 1.6% | 1.5% |
| Interquartile 75% (IQ3) | 2.5% | 2.3% |
| Interquartile Range (IQR) | 0.90% | 0.72% |
| Standard Deviation (Sample) | 1.3% | 0.58% |
| Standard Deviation (Population) | 1.3% | 0.57% |
Demographics Similar to Paraguayans and Somalis by Vision Disability
In terms of vision disability, the demographic groups most similar to Paraguayans are Palestinian (2.0%, a difference of 0.020%), Immigrants from North Macedonia (2.0%, a difference of 0.020%), Immigrants from Eritrea (2.0%, a difference of 0.070%), Immigrants from France (2.0%, a difference of 0.27%), and Immigrants from Northern Europe (2.0%, a difference of 0.32%). Similarly, the demographic groups most similar to Somalis are Jordanian (2.0%, a difference of 0.020%), Immigrants from Saudi Arabia (2.0%, a difference of 0.070%), Argentinean (2.0%, a difference of 0.21%), Immigrants from Romania (2.0%, a difference of 0.24%), and Immigrants from Belgium (2.0%, a difference of 0.25%).
| Demographics | Rating | Rank | Vision Disability |
| Jordanians | 99.2 /100 | #56 | Exceptional 2.0% |
| Somalis | 99.2 /100 | #57 | Exceptional 2.0% |
| Immigrants | Saudi Arabia | 99.2 /100 | #58 | Exceptional 2.0% |
| Argentineans | 99.1 /100 | #59 | Exceptional 2.0% |
| Immigrants | Romania | 99.1 /100 | #60 | Exceptional 2.0% |
| Immigrants | Belgium | 99.1 /100 | #61 | Exceptional 2.0% |
| Immigrants | Russia | 99.1 /100 | #62 | Exceptional 2.0% |
| Armenians | 99.0 /100 | #63 | Exceptional 2.0% |
| Immigrants | Greece | 99.0 /100 | #64 | Exceptional 2.0% |
| Maltese | 98.9 /100 | #65 | Exceptional 2.0% |
| Immigrants | Argentina | 98.9 /100 | #66 | Exceptional 2.0% |
| Immigrants | Northern Africa | 98.8 /100 | #67 | Exceptional 2.0% |
| Immigrants | Czechoslovakia | 98.7 /100 | #68 | Exceptional 2.0% |
| Russians | 98.6 /100 | #69 | Exceptional 2.0% |
| Immigrants | Kazakhstan | 98.6 /100 | #70 | Exceptional 2.0% |
| Immigrants | Northern Europe | 98.6 /100 | #71 | Exceptional 2.0% |
| Immigrants | France | 98.5 /100 | #72 | Exceptional 2.0% |
| Immigrants | Eritrea | 98.4 /100 | #73 | Exceptional 2.0% |
| Palestinians | 98.3 /100 | #74 | Exceptional 2.0% |
| Immigrants | North Macedonia | 98.3 /100 | #75 | Exceptional 2.0% |
| Paraguayans | 98.3 /100 | #76 | Exceptional 2.0% |