Paraguayan vs Immigrants from Laos Vision Disability
COMPARE
Paraguayan
Immigrants from Laos
Vision Disability
Vision Disability Comparison
Paraguayans
Immigrants from Laos
2.0%
VISION DISABILITY
98.3/ 100
METRIC RATING
76th/ 347
METRIC RANK
2.4%
VISION DISABILITY
0.4/ 100
METRIC RATING
251st/ 347
METRIC RANK
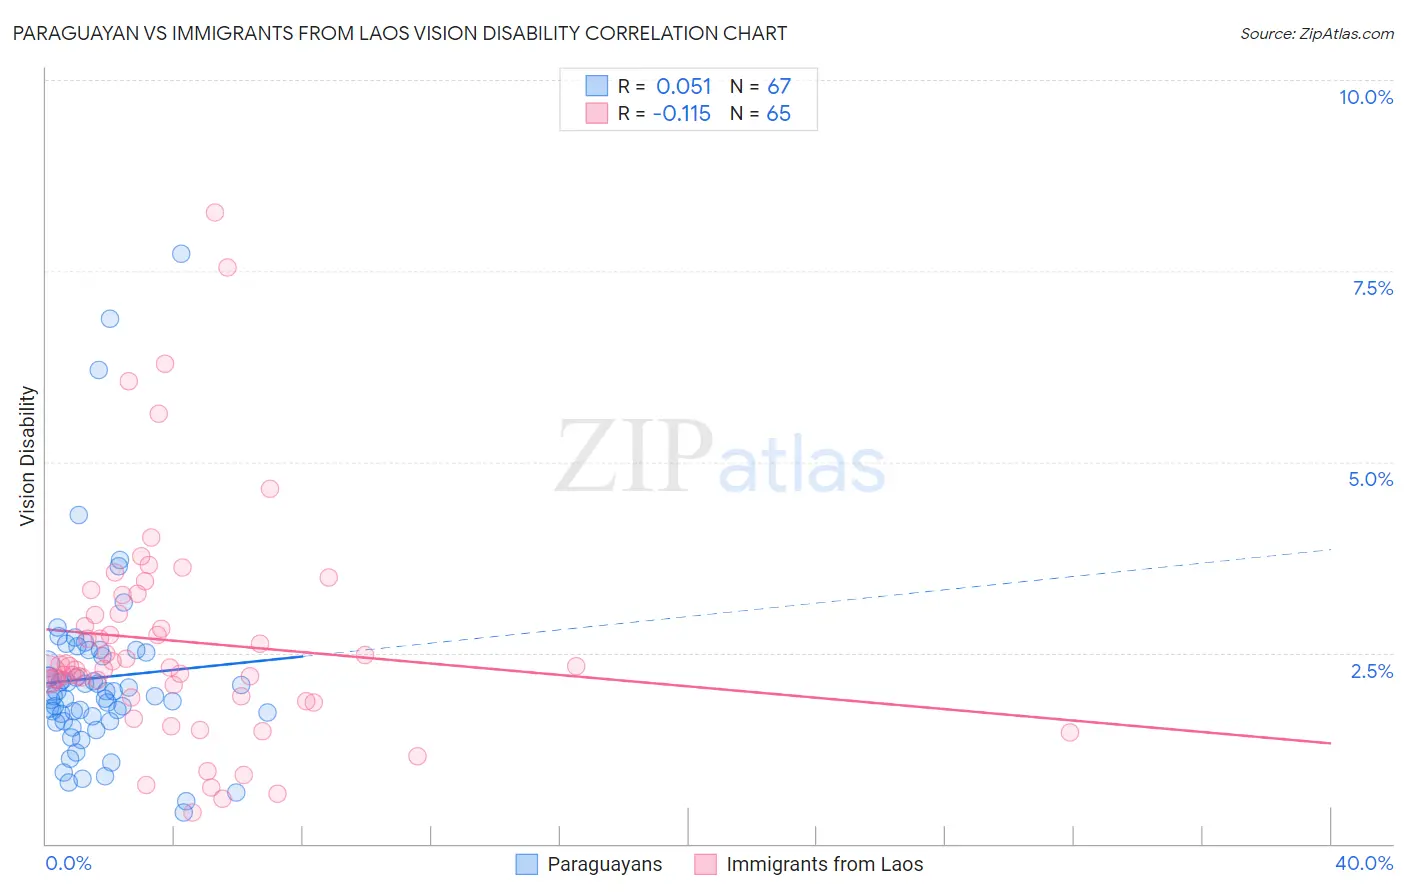
Paraguayan vs Immigrants from Laos Vision Disability Correlation Chart
The statistical analysis conducted on geographies consisting of 95,099,644 people shows a slight positive correlation between the proportion of Paraguayans and percentage of population with vision disability in the United States with a correlation coefficient (R) of 0.051 and weighted average of 2.0%. Similarly, the statistical analysis conducted on geographies consisting of 201,435,761 people shows a poor negative correlation between the proportion of Immigrants from Laos and percentage of population with vision disability in the United States with a correlation coefficient (R) of -0.115 and weighted average of 2.4%, a difference of 16.0%.
Vision Disability Correlation Summary
| Measurement | Paraguayan | Immigrants from Laos |
| Minimum | 0.41% | 0.41% |
| Maximum | 7.7% | 8.3% |
| Range | 7.3% | 7.8% |
| Mean | 2.2% | 2.7% |
| Median | 1.9% | 2.3% |
| Interquartile 25% (IQ1) | 1.6% | 1.9% |
| Interquartile 75% (IQ3) | 2.5% | 3.1% |
| Interquartile Range (IQR) | 0.90% | 1.2% |
| Standard Deviation (Sample) | 1.3% | 1.5% |
| Standard Deviation (Population) | 1.3% | 1.5% |
Similar Demographics by Vision Disability
Demographics Similar to Paraguayans by Vision Disability
In terms of vision disability, the demographic groups most similar to Paraguayans are Immigrants from Jordan (2.0%, a difference of 0.0%), Palestinian (2.0%, a difference of 0.020%), Immigrants from North Macedonia (2.0%, a difference of 0.020%), Immigrants from Eastern Europe (2.0%, a difference of 0.030%), and Immigrants from Eritrea (2.0%, a difference of 0.070%).
| Demographics | Rating | Rank | Vision Disability |
| Russians | 98.6 /100 | #69 | Exceptional 2.0% |
| Immigrants | Kazakhstan | 98.6 /100 | #70 | Exceptional 2.0% |
| Immigrants | Northern Europe | 98.6 /100 | #71 | Exceptional 2.0% |
| Immigrants | France | 98.5 /100 | #72 | Exceptional 2.0% |
| Immigrants | Eritrea | 98.4 /100 | #73 | Exceptional 2.0% |
| Palestinians | 98.3 /100 | #74 | Exceptional 2.0% |
| Immigrants | North Macedonia | 98.3 /100 | #75 | Exceptional 2.0% |
| Paraguayans | 98.3 /100 | #76 | Exceptional 2.0% |
| Immigrants | Jordan | 98.3 /100 | #77 | Exceptional 2.0% |
| Immigrants | Eastern Europe | 98.3 /100 | #78 | Exceptional 2.0% |
| Assyrians/Chaldeans/Syriacs | 98.1 /100 | #79 | Exceptional 2.0% |
| Lithuanians | 97.7 /100 | #80 | Exceptional 2.0% |
| Soviet Union | 97.6 /100 | #81 | Exceptional 2.0% |
| Immigrants | Poland | 97.6 /100 | #82 | Exceptional 2.0% |
| Immigrants | Western Asia | 97.5 /100 | #83 | Exceptional 2.0% |
Demographics Similar to Immigrants from Laos by Vision Disability
In terms of vision disability, the demographic groups most similar to Immigrants from Laos are Bangladeshi (2.3%, a difference of 0.11%), Liberian (2.3%, a difference of 0.19%), Subsaharan African (2.3%, a difference of 0.21%), Guatemalan (2.3%, a difference of 0.23%), and French (2.3%, a difference of 0.27%).
| Demographics | Rating | Rank | Vision Disability |
| Immigrants | West Indies | 0.6 /100 | #244 | Tragic 2.3% |
| Alsatians | 0.6 /100 | #245 | Tragic 2.3% |
| French | 0.5 /100 | #246 | Tragic 2.3% |
| Guatemalans | 0.5 /100 | #247 | Tragic 2.3% |
| Sub-Saharan Africans | 0.5 /100 | #248 | Tragic 2.3% |
| Liberians | 0.5 /100 | #249 | Tragic 2.3% |
| Bangladeshis | 0.5 /100 | #250 | Tragic 2.3% |
| Immigrants | Laos | 0.4 /100 | #251 | Tragic 2.4% |
| Immigrants | Micronesia | 0.3 /100 | #252 | Tragic 2.4% |
| Japanese | 0.3 /100 | #253 | Tragic 2.4% |
| Haitians | 0.3 /100 | #254 | Tragic 2.4% |
| Immigrants | Guatemala | 0.3 /100 | #255 | Tragic 2.4% |
| Immigrants | Haiti | 0.2 /100 | #256 | Tragic 2.4% |
| West Indians | 0.2 /100 | #257 | Tragic 2.4% |
| British West Indians | 0.2 /100 | #258 | Tragic 2.4% |