Paraguayan vs Immigrants from Fiji Vision Disability
COMPARE
Paraguayan
Immigrants from Fiji
Vision Disability
Vision Disability Comparison
Paraguayans
Immigrants from Fiji
2.0%
VISION DISABILITY
98.3/ 100
METRIC RATING
76th/ 347
METRIC RANK
2.2%
VISION DISABILITY
47.6/ 100
METRIC RATING
175th/ 347
METRIC RANK
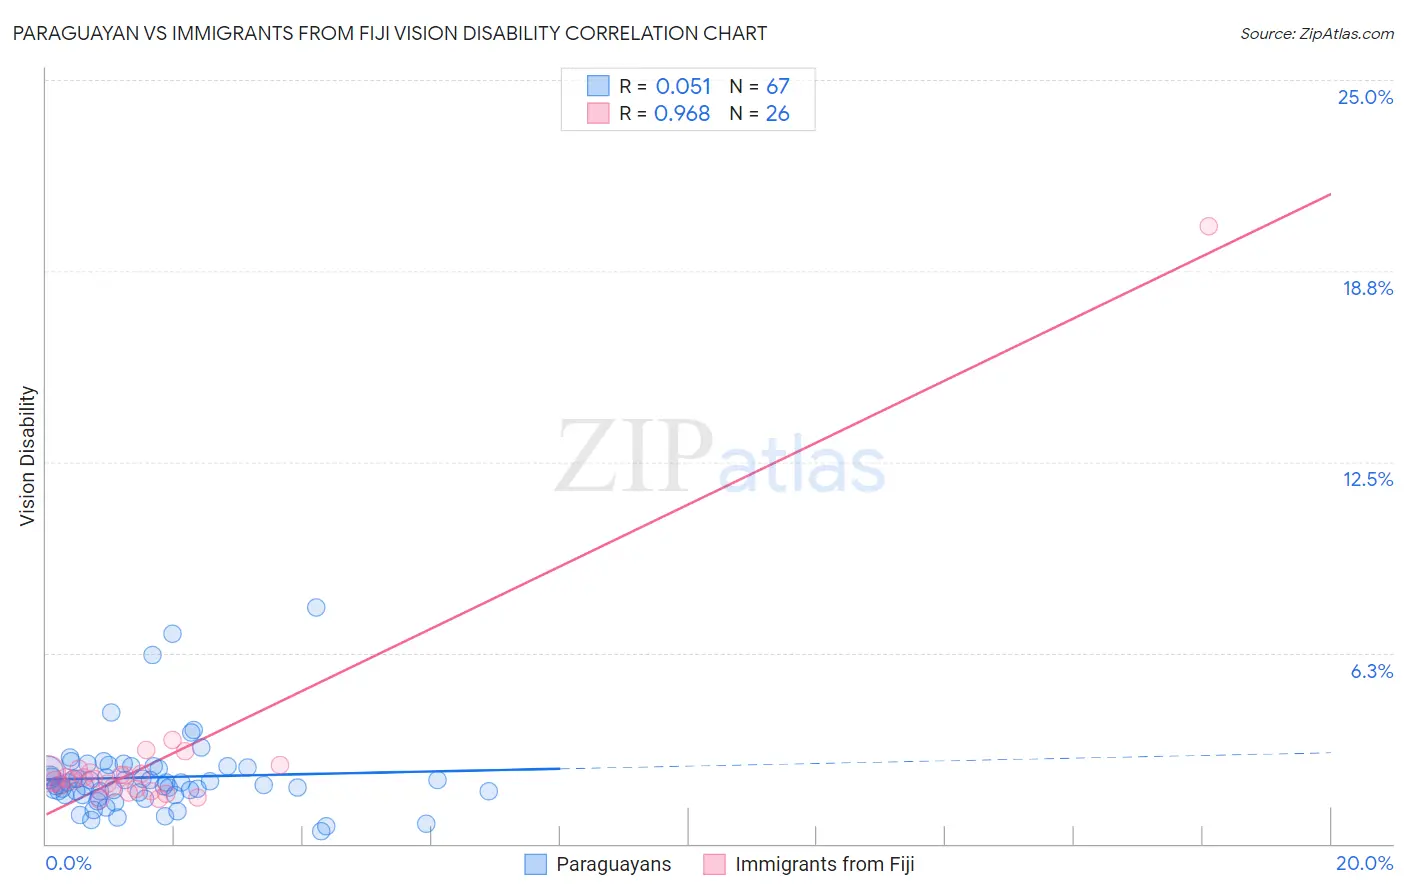
Paraguayan vs Immigrants from Fiji Vision Disability Correlation Chart
The statistical analysis conducted on geographies consisting of 95,099,644 people shows a slight positive correlation between the proportion of Paraguayans and percentage of population with vision disability in the United States with a correlation coefficient (R) of 0.051 and weighted average of 2.0%. Similarly, the statistical analysis conducted on geographies consisting of 93,750,153 people shows a perfect positive correlation between the proportion of Immigrants from Fiji and percentage of population with vision disability in the United States with a correlation coefficient (R) of 0.968 and weighted average of 2.2%, a difference of 7.0%.
Vision Disability Correlation Summary
| Measurement | Paraguayan | Immigrants from Fiji |
| Minimum | 0.41% | 1.4% |
| Maximum | 7.7% | 20.2% |
| Range | 7.3% | 18.8% |
| Mean | 2.2% | 2.8% |
| Median | 1.9% | 2.1% |
| Interquartile 25% (IQ1) | 1.6% | 1.8% |
| Interquartile 75% (IQ3) | 2.5% | 2.4% |
| Interquartile Range (IQR) | 0.90% | 0.56% |
| Standard Deviation (Sample) | 1.3% | 3.6% |
| Standard Deviation (Population) | 1.3% | 3.5% |
Similar Demographics by Vision Disability
Demographics Similar to Paraguayans by Vision Disability
In terms of vision disability, the demographic groups most similar to Paraguayans are Immigrants from Jordan (2.0%, a difference of 0.0%), Palestinian (2.0%, a difference of 0.020%), Immigrants from North Macedonia (2.0%, a difference of 0.020%), Immigrants from Eastern Europe (2.0%, a difference of 0.030%), and Immigrants from Eritrea (2.0%, a difference of 0.070%).
| Demographics | Rating | Rank | Vision Disability |
| Russians | 98.6 /100 | #69 | Exceptional 2.0% |
| Immigrants | Kazakhstan | 98.6 /100 | #70 | Exceptional 2.0% |
| Immigrants | Northern Europe | 98.6 /100 | #71 | Exceptional 2.0% |
| Immigrants | France | 98.5 /100 | #72 | Exceptional 2.0% |
| Immigrants | Eritrea | 98.4 /100 | #73 | Exceptional 2.0% |
| Palestinians | 98.3 /100 | #74 | Exceptional 2.0% |
| Immigrants | North Macedonia | 98.3 /100 | #75 | Exceptional 2.0% |
| Paraguayans | 98.3 /100 | #76 | Exceptional 2.0% |
| Immigrants | Jordan | 98.3 /100 | #77 | Exceptional 2.0% |
| Immigrants | Eastern Europe | 98.3 /100 | #78 | Exceptional 2.0% |
| Assyrians/Chaldeans/Syriacs | 98.1 /100 | #79 | Exceptional 2.0% |
| Lithuanians | 97.7 /100 | #80 | Exceptional 2.0% |
| Soviet Union | 97.6 /100 | #81 | Exceptional 2.0% |
| Immigrants | Poland | 97.6 /100 | #82 | Exceptional 2.0% |
| Immigrants | Western Asia | 97.5 /100 | #83 | Exceptional 2.0% |
Demographics Similar to Immigrants from Fiji by Vision Disability
In terms of vision disability, the demographic groups most similar to Immigrants from Fiji are Yugoslavian (2.2%, a difference of 0.070%), Slavic (2.2%, a difference of 0.11%), Scandinavian (2.2%, a difference of 0.15%), Immigrants from Canada (2.2%, a difference of 0.15%), and Northern European (2.2%, a difference of 0.16%).
| Demographics | Rating | Rank | Vision Disability |
| Brazilians | 62.2 /100 | #168 | Good 2.1% |
| South American Indians | 57.4 /100 | #169 | Average 2.2% |
| Swiss | 55.7 /100 | #170 | Average 2.2% |
| Lebanese | 54.3 /100 | #171 | Average 2.2% |
| Northern Europeans | 50.1 /100 | #172 | Average 2.2% |
| Scandinavians | 50.0 /100 | #173 | Average 2.2% |
| Immigrants | Canada | 50.0 /100 | #174 | Average 2.2% |
| Immigrants | Fiji | 47.6 /100 | #175 | Average 2.2% |
| Yugoslavians | 46.5 /100 | #176 | Average 2.2% |
| Slavs | 46.0 /100 | #177 | Average 2.2% |
| Immigrants | Oceania | 45.1 /100 | #178 | Average 2.2% |
| Immigrants | North America | 44.5 /100 | #179 | Average 2.2% |
| Uruguayans | 42.7 /100 | #180 | Average 2.2% |
| Immigrants | Western Europe | 41.1 /100 | #181 | Average 2.2% |
| Costa Ricans | 40.7 /100 | #182 | Average 2.2% |