Palestinian vs Latvian Unemployment Among Ages 60 to 64 years
COMPARE
Palestinian
Latvian
Unemployment Among Ages 60 to 64 years
Unemployment Among Ages 60 to 64 years Comparison
Palestinians
Latvians
4.8%
UNEMPLOYMENT AMONG AGES 60 TO 64 YEARS
60.5/ 100
METRIC RATING
166th/ 347
METRIC RANK
4.8%
UNEMPLOYMENT AMONG AGES 60 TO 64 YEARS
79.1/ 100
METRIC RATING
148th/ 347
METRIC RANK
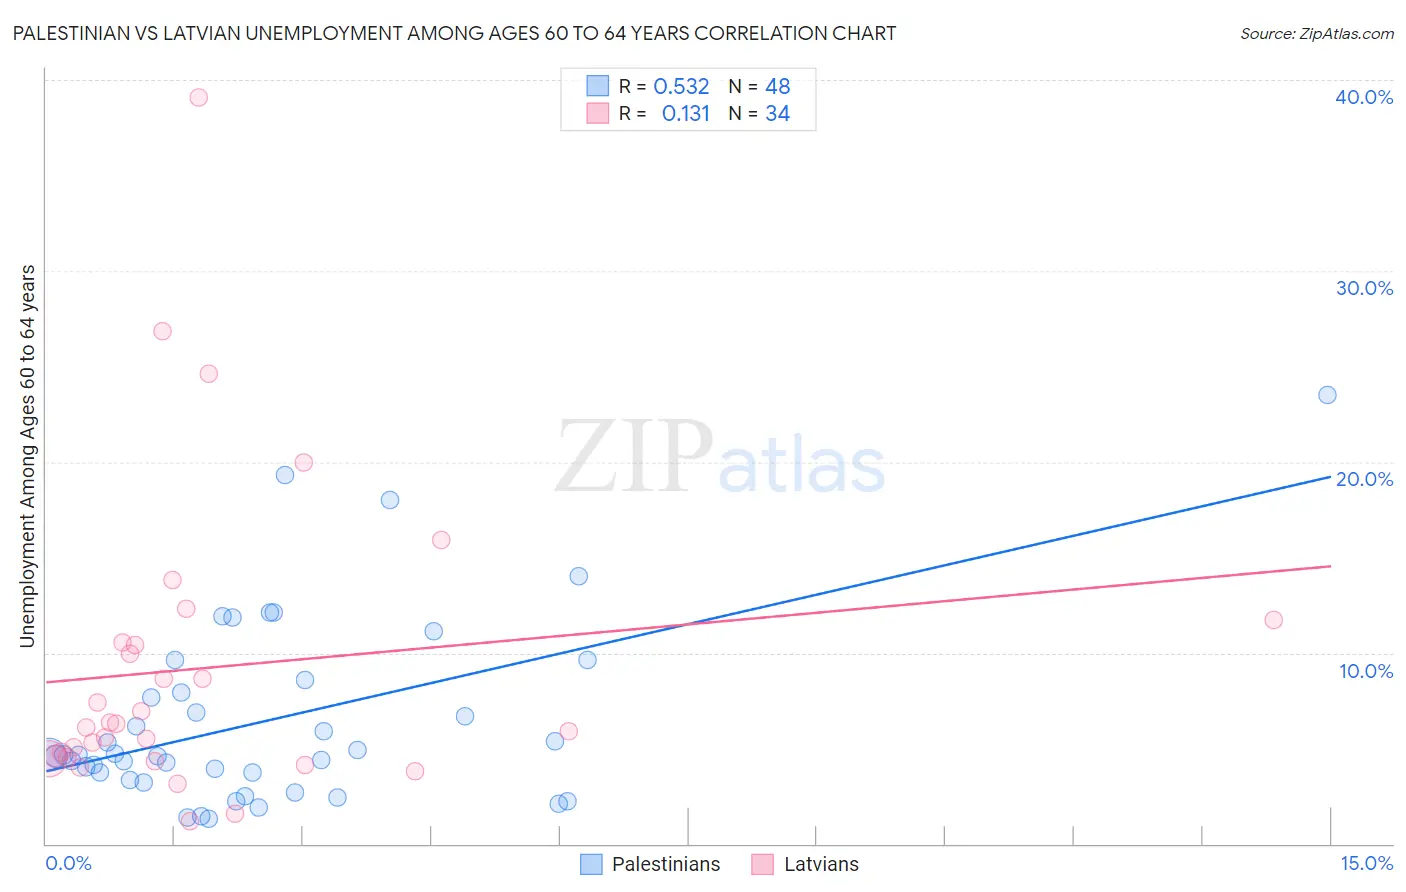
Palestinian vs Latvian Unemployment Among Ages 60 to 64 years Correlation Chart
The statistical analysis conducted on geographies consisting of 206,520,552 people shows a substantial positive correlation between the proportion of Palestinians and unemployment rate among population between the ages 60 and 64 in the United States with a correlation coefficient (R) of 0.532 and weighted average of 4.8%. Similarly, the statistical analysis conducted on geographies consisting of 207,612,955 people shows a poor positive correlation between the proportion of Latvians and unemployment rate among population between the ages 60 and 64 in the United States with a correlation coefficient (R) of 0.131 and weighted average of 4.8%, a difference of 0.81%.
Unemployment Among Ages 60 to 64 years Correlation Summary
| Measurement | Palestinian | Latvian |
| Minimum | 1.3% | 1.2% |
| Maximum | 23.5% | 39.1% |
| Range | 22.2% | 37.9% |
| Mean | 6.5% | 9.2% |
| Median | 4.7% | 6.2% |
| Interquartile 25% (IQ1) | 3.5% | 4.5% |
| Interquartile 75% (IQ3) | 8.3% | 10.5% |
| Interquartile Range (IQR) | 4.7% | 6.0% |
| Standard Deviation (Sample) | 4.9% | 8.0% |
| Standard Deviation (Population) | 4.8% | 7.9% |
Demographics Similar to Palestinians and Latvians by Unemployment Among Ages 60 to 64 years
In terms of unemployment among ages 60 to 64 years, the demographic groups most similar to Palestinians are Immigrants from Northern Europe (4.8%, a difference of 0.050%), Immigrants from Panama (4.8%, a difference of 0.060%), Immigrants from Belgium (4.8%, a difference of 0.16%), Pakistani (4.8%, a difference of 0.16%), and South African (4.8%, a difference of 0.17%). Similarly, the demographic groups most similar to Latvians are Arab (4.8%, a difference of 0.020%), Immigrants from Italy (4.8%, a difference of 0.020%), Immigrants from South Africa (4.8%, a difference of 0.030%), Mongolian (4.8%, a difference of 0.12%), and American (4.8%, a difference of 0.17%).
| Demographics | Rating | Rank | Unemployment Among Ages 60 to 64 years |
| Mongolians | 81.2 /100 | #147 | Excellent 4.8% |
| Latvians | 79.1 /100 | #148 | Good 4.8% |
| Arabs | 78.8 /100 | #149 | Good 4.8% |
| Immigrants | Italy | 78.7 /100 | #150 | Good 4.8% |
| Immigrants | South Africa | 78.5 /100 | #151 | Good 4.8% |
| Americans | 75.7 /100 | #152 | Good 4.8% |
| Bolivians | 75.5 /100 | #153 | Good 4.8% |
| Chileans | 72.6 /100 | #154 | Good 4.8% |
| Filipinos | 72.1 /100 | #155 | Good 4.8% |
| Immigrants | Bolivia | 69.2 /100 | #156 | Good 4.8% |
| Laotians | 66.8 /100 | #157 | Good 4.8% |
| Immigrants | Taiwan | 66.0 /100 | #158 | Good 4.8% |
| Spanish | 65.5 /100 | #159 | Good 4.8% |
| Australians | 65.3 /100 | #160 | Good 4.8% |
| Immigrants | Norway | 65.1 /100 | #161 | Good 4.8% |
| South Africans | 65.1 /100 | #162 | Good 4.8% |
| Immigrants | Belgium | 64.8 /100 | #163 | Good 4.8% |
| Pakistanis | 64.6 /100 | #164 | Good 4.8% |
| Immigrants | Panama | 62.0 /100 | #165 | Good 4.8% |
| Palestinians | 60.5 /100 | #166 | Good 4.8% |
| Immigrants | Northern Europe | 59.1 /100 | #167 | Average 4.8% |