Delaware vs Ugandan Vision Disability
COMPARE
Delaware
Ugandan
Vision Disability
Vision Disability Comparison
Delaware
Ugandans
2.5%
VISION DISABILITY
0.0/ 100
METRIC RATING
295th/ 347
METRIC RANK
2.1%
VISION DISABILITY
92.2/ 100
METRIC RATING
116th/ 347
METRIC RANK
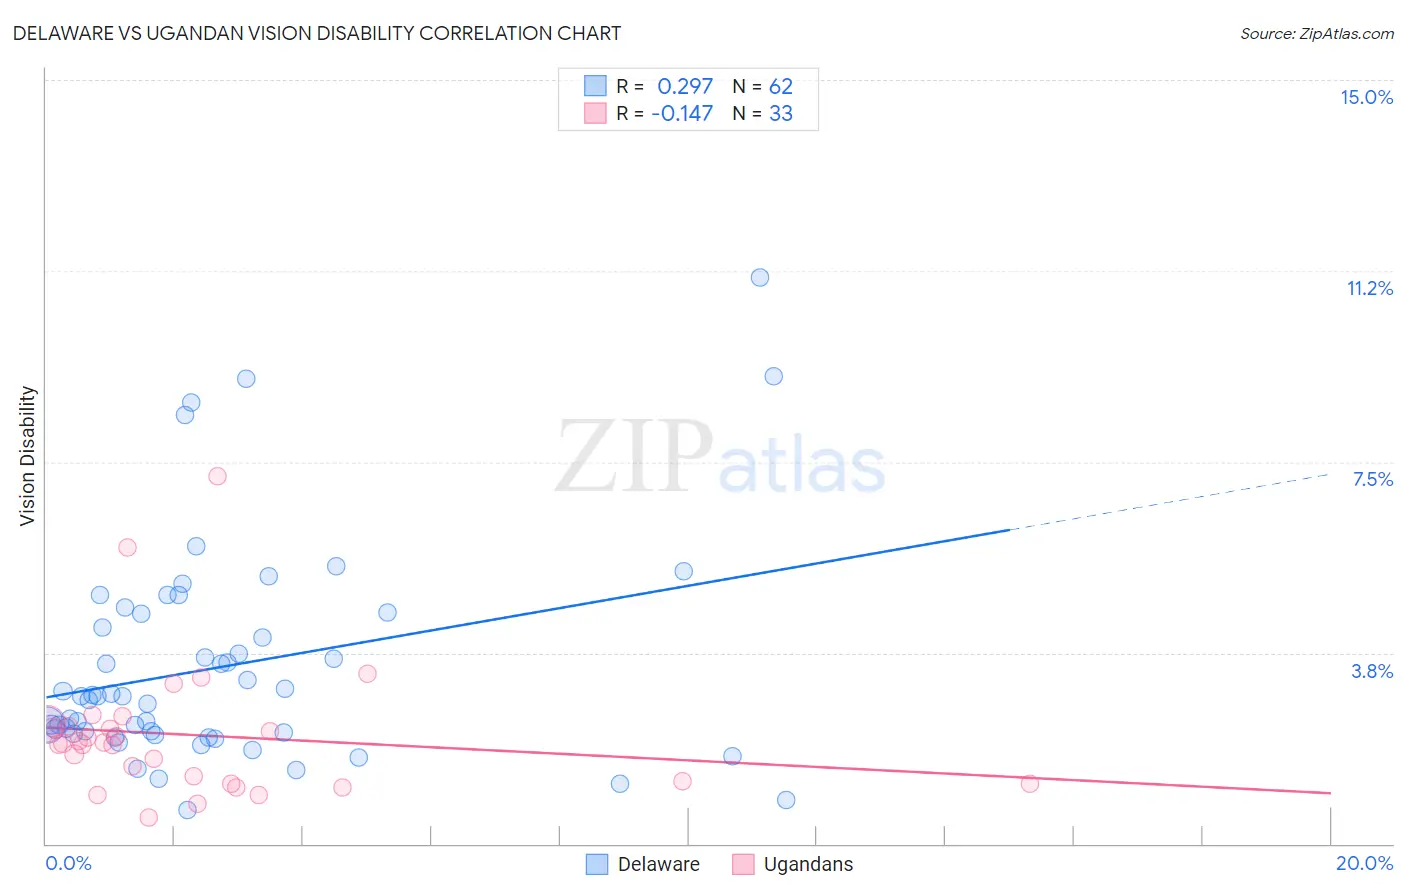
Delaware vs Ugandan Vision Disability Correlation Chart
The statistical analysis conducted on geographies consisting of 96,219,222 people shows a weak positive correlation between the proportion of Delaware and percentage of population with vision disability in the United States with a correlation coefficient (R) of 0.297 and weighted average of 2.5%. Similarly, the statistical analysis conducted on geographies consisting of 94,002,961 people shows a poor negative correlation between the proportion of Ugandans and percentage of population with vision disability in the United States with a correlation coefficient (R) of -0.147 and weighted average of 2.1%, a difference of 20.5%.
Vision Disability Correlation Summary
| Measurement | Delaware | Ugandan |
| Minimum | 0.66% | 0.51% |
| Maximum | 11.1% | 7.2% |
| Range | 10.5% | 6.7% |
| Mean | 3.5% | 2.1% |
| Median | 2.9% | 2.0% |
| Interquartile 25% (IQ1) | 2.2% | 1.2% |
| Interquartile 75% (IQ3) | 4.5% | 2.3% |
| Interquartile Range (IQR) | 2.3% | 1.1% |
| Standard Deviation (Sample) | 2.1% | 1.3% |
| Standard Deviation (Population) | 2.1% | 1.3% |
Similar Demographics by Vision Disability
Demographics Similar to Delaware by Vision Disability
In terms of vision disability, the demographic groups most similar to Delaware are Immigrants from Mexico (2.5%, a difference of 0.11%), Ottawa (2.5%, a difference of 0.21%), Yaqui (2.5%, a difference of 0.55%), Crow (2.5%, a difference of 0.58%), and Immigrants from Honduras (2.5%, a difference of 0.67%).
| Demographics | Rating | Rank | Vision Disability |
| French American Indians | 0.0 /100 | #288 | Tragic 2.5% |
| Immigrants | Nonimmigrants | 0.0 /100 | #289 | Tragic 2.5% |
| Immigrants | Cuba | 0.0 /100 | #290 | Tragic 2.5% |
| Immigrants | Honduras | 0.0 /100 | #291 | Tragic 2.5% |
| Crow | 0.0 /100 | #292 | Tragic 2.5% |
| Yaqui | 0.0 /100 | #293 | Tragic 2.5% |
| Ottawa | 0.0 /100 | #294 | Tragic 2.5% |
| Delaware | 0.0 /100 | #295 | Tragic 2.5% |
| Immigrants | Mexico | 0.0 /100 | #296 | Tragic 2.5% |
| Immigrants | Dominica | 0.0 /100 | #297 | Tragic 2.5% |
| Mexicans | 0.0 /100 | #298 | Tragic 2.5% |
| Cree | 0.0 /100 | #299 | Tragic 2.5% |
| Africans | 0.0 /100 | #300 | Tragic 2.5% |
| Menominee | 0.0 /100 | #301 | Tragic 2.5% |
| Spanish American Indians | 0.0 /100 | #302 | Tragic 2.6% |
Demographics Similar to Ugandans by Vision Disability
In terms of vision disability, the demographic groups most similar to Ugandans are Immigrants from Vietnam (2.1%, a difference of 0.0%), Croatian (2.1%, a difference of 0.030%), Polish (2.1%, a difference of 0.040%), Kenyan (2.1%, a difference of 0.060%), and Immigrants from Denmark (2.1%, a difference of 0.18%).
| Demographics | Rating | Rank | Vision Disability |
| Chileans | 94.0 /100 | #109 | Exceptional 2.1% |
| Immigrants | Armenia | 93.8 /100 | #110 | Exceptional 2.1% |
| Peruvians | 93.5 /100 | #111 | Exceptional 2.1% |
| Immigrants | Denmark | 92.9 /100 | #112 | Exceptional 2.1% |
| Kenyans | 92.5 /100 | #113 | Exceptional 2.1% |
| Croatians | 92.3 /100 | #114 | Exceptional 2.1% |
| Immigrants | Vietnam | 92.2 /100 | #115 | Exceptional 2.1% |
| Ugandans | 92.2 /100 | #116 | Exceptional 2.1% |
| Poles | 92.0 /100 | #117 | Exceptional 2.1% |
| Immigrants | Philippines | 91.4 /100 | #118 | Exceptional 2.1% |
| Immigrants | Uganda | 91.4 /100 | #119 | Exceptional 2.1% |
| Immigrants | Zimbabwe | 91.0 /100 | #120 | Exceptional 2.1% |
| Immigrants | Scotland | 90.4 /100 | #121 | Exceptional 2.1% |
| Immigrants | Ukraine | 90.4 /100 | #122 | Exceptional 2.1% |
| Immigrants | Albania | 90.4 /100 | #123 | Exceptional 2.1% |