Immigrants from Eastern Europe vs Ugandan Vision Disability
COMPARE
Immigrants from Eastern Europe
Ugandan
Vision Disability
Vision Disability Comparison
Immigrants from Eastern Europe
Ugandans
2.0%
VISION DISABILITY
98.3/ 100
METRIC RATING
78th/ 347
METRIC RANK
2.1%
VISION DISABILITY
92.2/ 100
METRIC RATING
116th/ 347
METRIC RANK
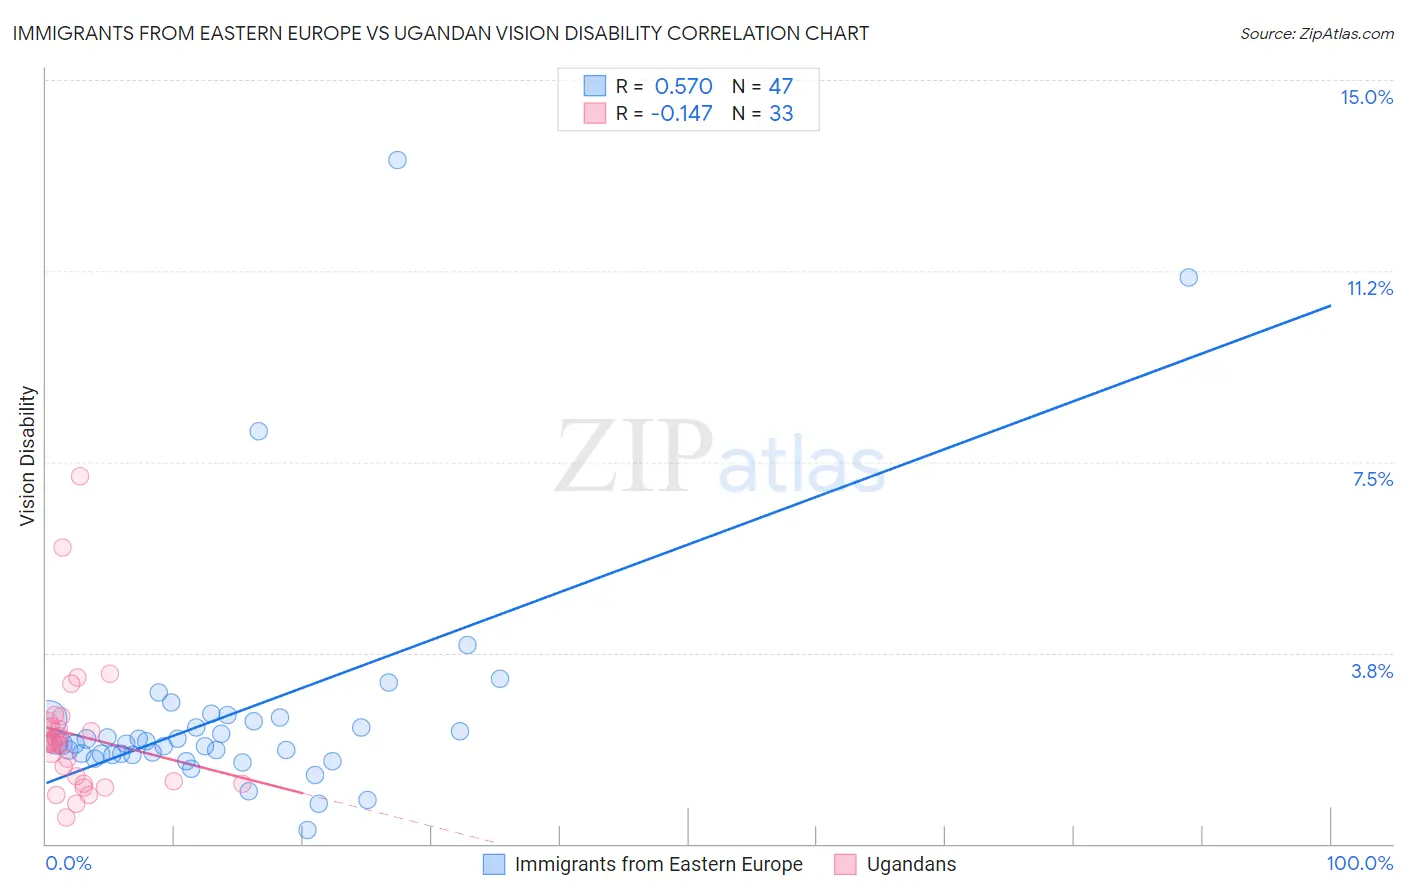
Immigrants from Eastern Europe vs Ugandan Vision Disability Correlation Chart
The statistical analysis conducted on geographies consisting of 475,183,449 people shows a substantial positive correlation between the proportion of Immigrants from Eastern Europe and percentage of population with vision disability in the United States with a correlation coefficient (R) of 0.570 and weighted average of 2.0%. Similarly, the statistical analysis conducted on geographies consisting of 94,002,961 people shows a poor negative correlation between the proportion of Ugandans and percentage of population with vision disability in the United States with a correlation coefficient (R) of -0.147 and weighted average of 2.1%, a difference of 2.6%.
Vision Disability Correlation Summary
| Measurement | Immigrants from Eastern Europe | Ugandan |
| Minimum | 0.27% | 0.51% |
| Maximum | 13.4% | 7.2% |
| Range | 13.2% | 6.7% |
| Mean | 2.6% | 2.1% |
| Median | 2.0% | 2.0% |
| Interquartile 25% (IQ1) | 1.8% | 1.2% |
| Interquartile 75% (IQ3) | 2.4% | 2.3% |
| Interquartile Range (IQR) | 0.70% | 1.1% |
| Standard Deviation (Sample) | 2.3% | 1.3% |
| Standard Deviation (Population) | 2.3% | 1.3% |
Similar Demographics by Vision Disability
Demographics Similar to Immigrants from Eastern Europe by Vision Disability
In terms of vision disability, the demographic groups most similar to Immigrants from Eastern Europe are Paraguayan (2.0%, a difference of 0.030%), Immigrants from Jordan (2.0%, a difference of 0.030%), Palestinian (2.0%, a difference of 0.050%), Immigrants from North Macedonia (2.0%, a difference of 0.050%), and Immigrants from Eritrea (2.0%, a difference of 0.11%).
| Demographics | Rating | Rank | Vision Disability |
| Immigrants | Northern Europe | 98.6 /100 | #71 | Exceptional 2.0% |
| Immigrants | France | 98.5 /100 | #72 | Exceptional 2.0% |
| Immigrants | Eritrea | 98.4 /100 | #73 | Exceptional 2.0% |
| Palestinians | 98.3 /100 | #74 | Exceptional 2.0% |
| Immigrants | North Macedonia | 98.3 /100 | #75 | Exceptional 2.0% |
| Paraguayans | 98.3 /100 | #76 | Exceptional 2.0% |
| Immigrants | Jordan | 98.3 /100 | #77 | Exceptional 2.0% |
| Immigrants | Eastern Europe | 98.3 /100 | #78 | Exceptional 2.0% |
| Assyrians/Chaldeans/Syriacs | 98.1 /100 | #79 | Exceptional 2.0% |
| Lithuanians | 97.7 /100 | #80 | Exceptional 2.0% |
| Soviet Union | 97.6 /100 | #81 | Exceptional 2.0% |
| Immigrants | Poland | 97.6 /100 | #82 | Exceptional 2.0% |
| Immigrants | Western Asia | 97.5 /100 | #83 | Exceptional 2.0% |
| Immigrants | Latvia | 97.3 /100 | #84 | Exceptional 2.0% |
| Chinese | 97.2 /100 | #85 | Exceptional 2.0% |
Demographics Similar to Ugandans by Vision Disability
In terms of vision disability, the demographic groups most similar to Ugandans are Immigrants from Vietnam (2.1%, a difference of 0.0%), Croatian (2.1%, a difference of 0.030%), Polish (2.1%, a difference of 0.040%), Kenyan (2.1%, a difference of 0.060%), and Immigrants from Denmark (2.1%, a difference of 0.18%).
| Demographics | Rating | Rank | Vision Disability |
| Chileans | 94.0 /100 | #109 | Exceptional 2.1% |
| Immigrants | Armenia | 93.8 /100 | #110 | Exceptional 2.1% |
| Peruvians | 93.5 /100 | #111 | Exceptional 2.1% |
| Immigrants | Denmark | 92.9 /100 | #112 | Exceptional 2.1% |
| Kenyans | 92.5 /100 | #113 | Exceptional 2.1% |
| Croatians | 92.3 /100 | #114 | Exceptional 2.1% |
| Immigrants | Vietnam | 92.2 /100 | #115 | Exceptional 2.1% |
| Ugandans | 92.2 /100 | #116 | Exceptional 2.1% |
| Poles | 92.0 /100 | #117 | Exceptional 2.1% |
| Immigrants | Philippines | 91.4 /100 | #118 | Exceptional 2.1% |
| Immigrants | Uganda | 91.4 /100 | #119 | Exceptional 2.1% |
| Immigrants | Zimbabwe | 91.0 /100 | #120 | Exceptional 2.1% |
| Immigrants | Scotland | 90.4 /100 | #121 | Exceptional 2.1% |
| Immigrants | Ukraine | 90.4 /100 | #122 | Exceptional 2.1% |
| Immigrants | Albania | 90.4 /100 | #123 | Exceptional 2.1% |