Immigrants from Haiti vs Central American Vision Disability
COMPARE
Immigrants from Haiti
Central American
Vision Disability
Vision Disability Comparison
Immigrants from Haiti
Central Americans
2.4%
VISION DISABILITY
0.2/ 100
METRIC RATING
256th/ 347
METRIC RANK
2.3%
VISION DISABILITY
1.8/ 100
METRIC RATING
233rd/ 347
METRIC RANK
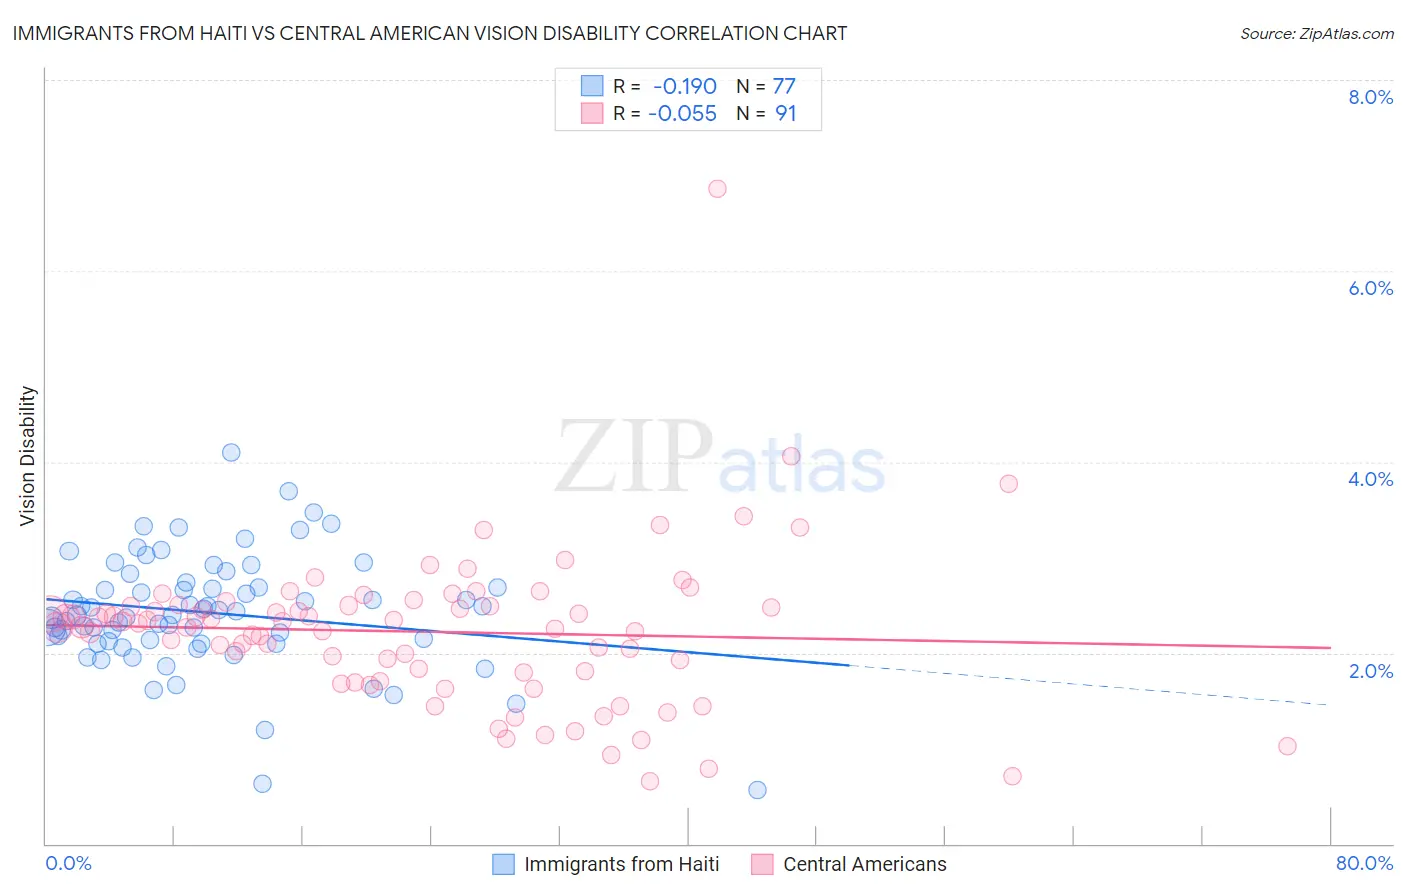
Immigrants from Haiti vs Central American Vision Disability Correlation Chart
The statistical analysis conducted on geographies consisting of 225,143,301 people shows a poor negative correlation between the proportion of Immigrants from Haiti and percentage of population with vision disability in the United States with a correlation coefficient (R) of -0.190 and weighted average of 2.4%. Similarly, the statistical analysis conducted on geographies consisting of 503,926,566 people shows a slight negative correlation between the proportion of Central Americans and percentage of population with vision disability in the United States with a correlation coefficient (R) of -0.055 and weighted average of 2.3%, a difference of 3.2%.
Vision Disability Correlation Summary
| Measurement | Immigrants from Haiti | Central American |
| Minimum | 0.56% | 0.66% |
| Maximum | 4.1% | 6.9% |
| Range | 3.5% | 6.2% |
| Mean | 2.4% | 2.2% |
| Median | 2.4% | 2.3% |
| Interquartile 25% (IQ1) | 2.1% | 1.8% |
| Interquartile 75% (IQ3) | 2.7% | 2.5% |
| Interquartile Range (IQR) | 0.60% | 0.71% |
| Standard Deviation (Sample) | 0.60% | 0.81% |
| Standard Deviation (Population) | 0.60% | 0.81% |
Similar Demographics by Vision Disability
Demographics Similar to Immigrants from Haiti by Vision Disability
In terms of vision disability, the demographic groups most similar to Immigrants from Haiti are West Indian (2.4%, a difference of 0.080%), British West Indian (2.4%, a difference of 0.10%), White/Caucasian (2.4%, a difference of 0.12%), Belizean (2.4%, a difference of 0.29%), and Immigrants from Guatemala (2.4%, a difference of 0.33%).
| Demographics | Rating | Rank | Vision Disability |
| Liberians | 0.5 /100 | #249 | Tragic 2.3% |
| Bangladeshis | 0.5 /100 | #250 | Tragic 2.3% |
| Immigrants | Laos | 0.4 /100 | #251 | Tragic 2.4% |
| Immigrants | Micronesia | 0.3 /100 | #252 | Tragic 2.4% |
| Japanese | 0.3 /100 | #253 | Tragic 2.4% |
| Haitians | 0.3 /100 | #254 | Tragic 2.4% |
| Immigrants | Guatemala | 0.3 /100 | #255 | Tragic 2.4% |
| Immigrants | Haiti | 0.2 /100 | #256 | Tragic 2.4% |
| West Indians | 0.2 /100 | #257 | Tragic 2.4% |
| British West Indians | 0.2 /100 | #258 | Tragic 2.4% |
| Whites/Caucasians | 0.2 /100 | #259 | Tragic 2.4% |
| Belizeans | 0.2 /100 | #260 | Tragic 2.4% |
| Fijians | 0.1 /100 | #261 | Tragic 2.4% |
| Jamaicans | 0.1 /100 | #262 | Tragic 2.4% |
| Immigrants | Belize | 0.1 /100 | #263 | Tragic 2.4% |
Demographics Similar to Central Americans by Vision Disability
In terms of vision disability, the demographic groups most similar to Central Americans are German Russian (2.3%, a difference of 0.020%), Scottish (2.3%, a difference of 0.18%), Immigrants from Ecuador (2.3%, a difference of 0.20%), Marshallese (2.3%, a difference of 0.25%), and Immigrants from Congo (2.3%, a difference of 0.34%).
| Demographics | Rating | Rank | Vision Disability |
| Immigrants | Germany | 3.0 /100 | #226 | Tragic 2.3% |
| Hawaiians | 2.9 /100 | #227 | Tragic 2.3% |
| Hmong | 2.5 /100 | #228 | Tragic 2.3% |
| Welsh | 2.3 /100 | #229 | Tragic 2.3% |
| Nicaraguans | 2.2 /100 | #230 | Tragic 2.3% |
| Immigrants | Ecuador | 2.0 /100 | #231 | Tragic 2.3% |
| German Russians | 1.8 /100 | #232 | Tragic 2.3% |
| Central Americans | 1.8 /100 | #233 | Tragic 2.3% |
| Scottish | 1.6 /100 | #234 | Tragic 2.3% |
| Marshallese | 1.5 /100 | #235 | Tragic 2.3% |
| Immigrants | Congo | 1.4 /100 | #236 | Tragic 2.3% |
| Immigrants | Portugal | 1.4 /100 | #237 | Tragic 2.3% |
| Immigrants | Cambodia | 1.1 /100 | #238 | Tragic 2.3% |
| English | 1.1 /100 | #239 | Tragic 2.3% |
| Panamanians | 0.9 /100 | #240 | Tragic 2.3% |