Immigrants from South Central Asia vs Central American Vision Disability
COMPARE
Immigrants from South Central Asia
Central American
Vision Disability
Vision Disability Comparison
Immigrants from South Central Asia
Central Americans
1.8%
VISION DISABILITY
100.0/ 100
METRIC RATING
7th/ 347
METRIC RANK
2.3%
VISION DISABILITY
1.8/ 100
METRIC RATING
233rd/ 347
METRIC RANK
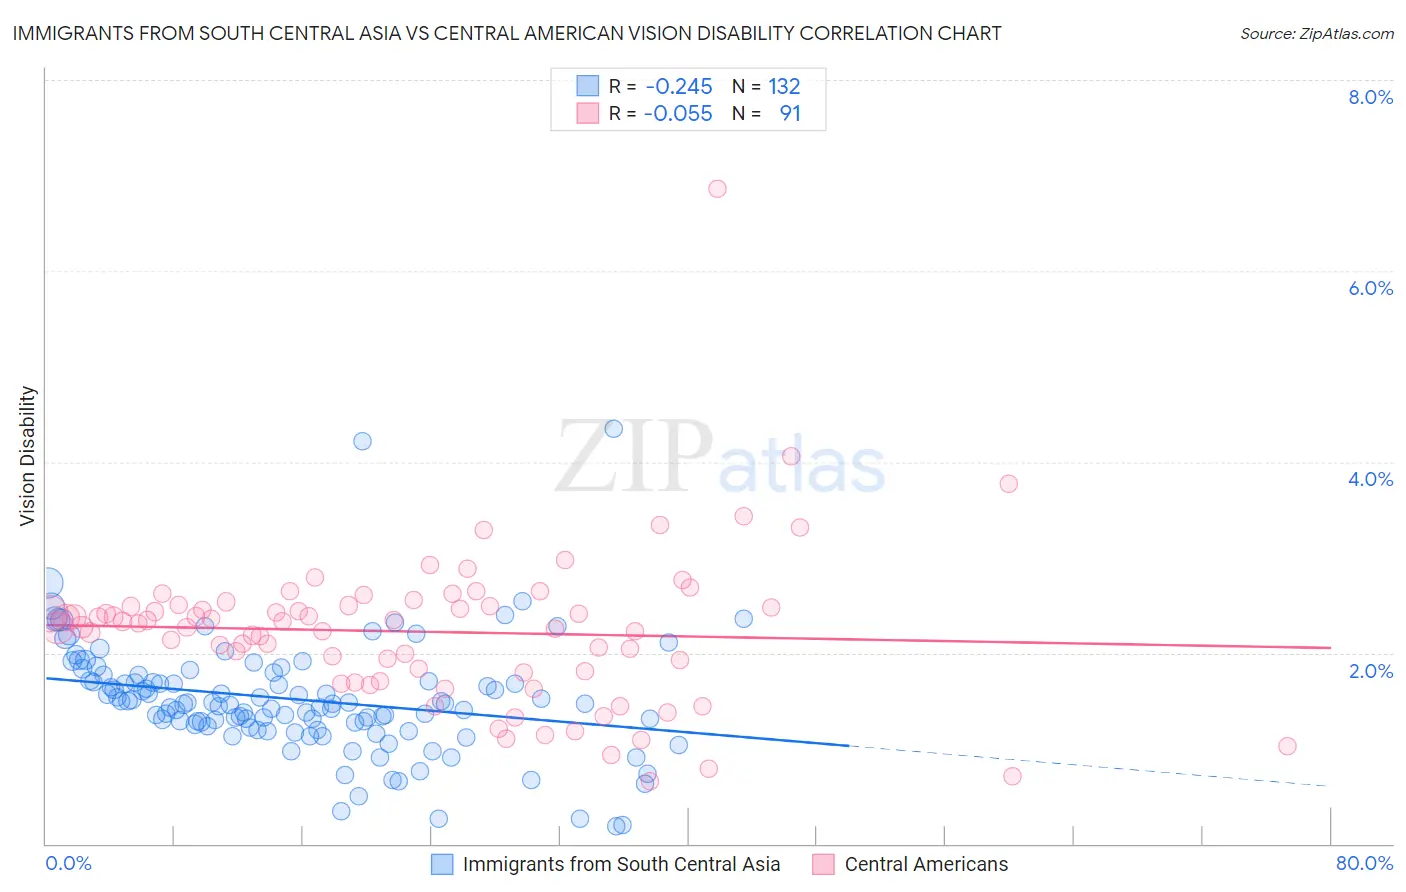
Immigrants from South Central Asia vs Central American Vision Disability Correlation Chart
The statistical analysis conducted on geographies consisting of 472,559,248 people shows a weak negative correlation between the proportion of Immigrants from South Central Asia and percentage of population with vision disability in the United States with a correlation coefficient (R) of -0.245 and weighted average of 1.8%. Similarly, the statistical analysis conducted on geographies consisting of 503,926,566 people shows a slight negative correlation between the proportion of Central Americans and percentage of population with vision disability in the United States with a correlation coefficient (R) of -0.055 and weighted average of 2.3%, a difference of 29.0%.
Vision Disability Correlation Summary
| Measurement | Immigrants from South Central Asia | Central American |
| Minimum | 0.18% | 0.66% |
| Maximum | 4.4% | 6.9% |
| Range | 4.2% | 6.2% |
| Mean | 1.5% | 2.2% |
| Median | 1.5% | 2.3% |
| Interquartile 25% (IQ1) | 1.2% | 1.8% |
| Interquartile 75% (IQ3) | 1.7% | 2.5% |
| Interquartile Range (IQR) | 0.50% | 0.71% |
| Standard Deviation (Sample) | 0.60% | 0.81% |
| Standard Deviation (Population) | 0.60% | 0.81% |
Similar Demographics by Vision Disability
Demographics Similar to Immigrants from South Central Asia by Vision Disability
In terms of vision disability, the demographic groups most similar to Immigrants from South Central Asia are Immigrants from Iran (1.8%, a difference of 0.060%), Iranian (1.8%, a difference of 0.15%), Okinawan (1.8%, a difference of 0.65%), Immigrants from Singapore (1.8%, a difference of 0.89%), and Immigrants from Hong Kong (1.8%, a difference of 1.1%).
| Demographics | Rating | Rank | Vision Disability |
| Immigrants | India | 100.0 /100 | #1 | Exceptional 1.7% |
| Filipinos | 100.0 /100 | #2 | Exceptional 1.7% |
| Immigrants | Taiwan | 100.0 /100 | #3 | Exceptional 1.7% |
| Thais | 100.0 /100 | #4 | Exceptional 1.7% |
| Okinawans | 100.0 /100 | #5 | Exceptional 1.8% |
| Immigrants | Iran | 100.0 /100 | #6 | Exceptional 1.8% |
| Immigrants | South Central Asia | 100.0 /100 | #7 | Exceptional 1.8% |
| Iranians | 100.0 /100 | #8 | Exceptional 1.8% |
| Immigrants | Singapore | 100.0 /100 | #9 | Exceptional 1.8% |
| Immigrants | Hong Kong | 100.0 /100 | #10 | Exceptional 1.8% |
| Immigrants | Israel | 100.0 /100 | #11 | Exceptional 1.8% |
| Immigrants | Korea | 100.0 /100 | #12 | Exceptional 1.8% |
| Immigrants | Eastern Asia | 100.0 /100 | #13 | Exceptional 1.8% |
| Immigrants | China | 100.0 /100 | #14 | Exceptional 1.8% |
| Immigrants | Bolivia | 100.0 /100 | #15 | Exceptional 1.8% |
Demographics Similar to Central Americans by Vision Disability
In terms of vision disability, the demographic groups most similar to Central Americans are German Russian (2.3%, a difference of 0.020%), Scottish (2.3%, a difference of 0.18%), Immigrants from Ecuador (2.3%, a difference of 0.20%), Marshallese (2.3%, a difference of 0.25%), and Immigrants from Congo (2.3%, a difference of 0.34%).
| Demographics | Rating | Rank | Vision Disability |
| Immigrants | Germany | 3.0 /100 | #226 | Tragic 2.3% |
| Hawaiians | 2.9 /100 | #227 | Tragic 2.3% |
| Hmong | 2.5 /100 | #228 | Tragic 2.3% |
| Welsh | 2.3 /100 | #229 | Tragic 2.3% |
| Nicaraguans | 2.2 /100 | #230 | Tragic 2.3% |
| Immigrants | Ecuador | 2.0 /100 | #231 | Tragic 2.3% |
| German Russians | 1.8 /100 | #232 | Tragic 2.3% |
| Central Americans | 1.8 /100 | #233 | Tragic 2.3% |
| Scottish | 1.6 /100 | #234 | Tragic 2.3% |
| Marshallese | 1.5 /100 | #235 | Tragic 2.3% |
| Immigrants | Congo | 1.4 /100 | #236 | Tragic 2.3% |
| Immigrants | Portugal | 1.4 /100 | #237 | Tragic 2.3% |
| Immigrants | Cambodia | 1.1 /100 | #238 | Tragic 2.3% |
| English | 1.1 /100 | #239 | Tragic 2.3% |
| Panamanians | 0.9 /100 | #240 | Tragic 2.3% |