Marshallese vs Central American Vision Disability
COMPARE
Marshallese
Central American
Vision Disability
Vision Disability Comparison
Marshallese
Central Americans
2.3%
VISION DISABILITY
1.5/ 100
METRIC RATING
235th/ 347
METRIC RANK
2.3%
VISION DISABILITY
1.8/ 100
METRIC RATING
233rd/ 347
METRIC RANK
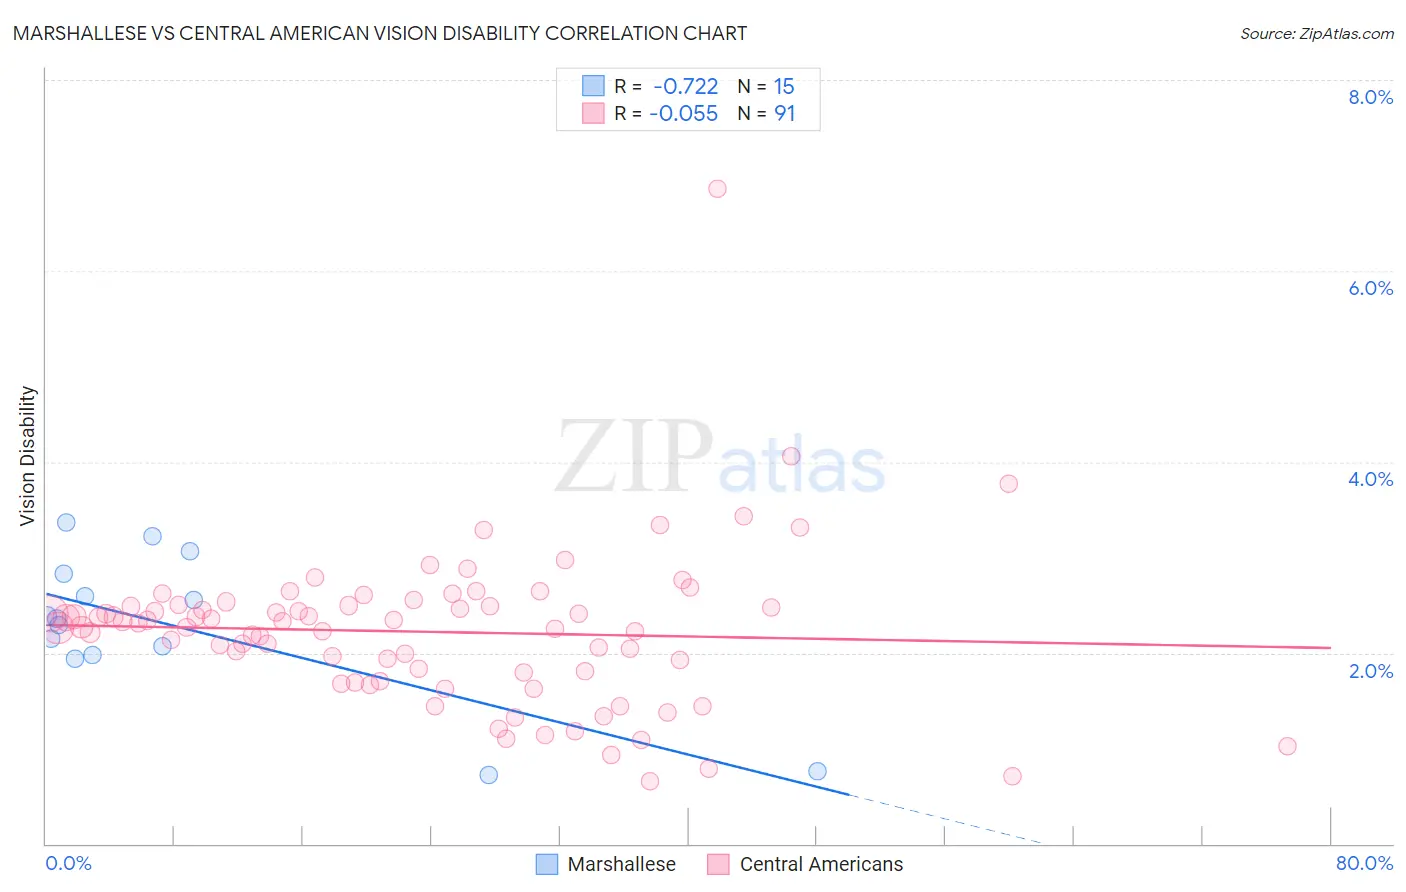
Marshallese vs Central American Vision Disability Correlation Chart
The statistical analysis conducted on geographies consisting of 14,759,042 people shows a strong negative correlation between the proportion of Marshallese and percentage of population with vision disability in the United States with a correlation coefficient (R) of -0.722 and weighted average of 2.3%. Similarly, the statistical analysis conducted on geographies consisting of 503,926,566 people shows a slight negative correlation between the proportion of Central Americans and percentage of population with vision disability in the United States with a correlation coefficient (R) of -0.055 and weighted average of 2.3%, a difference of 0.25%.
Vision Disability Correlation Summary
| Measurement | Marshallese | Central American |
| Minimum | 0.72% | 0.66% |
| Maximum | 3.4% | 6.9% |
| Range | 2.6% | 6.2% |
| Mean | 2.3% | 2.2% |
| Median | 2.4% | 2.3% |
| Interquartile 25% (IQ1) | 2.0% | 1.8% |
| Interquartile 75% (IQ3) | 2.8% | 2.5% |
| Interquartile Range (IQR) | 0.86% | 0.71% |
| Standard Deviation (Sample) | 0.76% | 0.81% |
| Standard Deviation (Population) | 0.74% | 0.81% |
Demographics Similar to Marshallese and Central Americans by Vision Disability
In terms of vision disability, the demographic groups most similar to Marshallese are Scottish (2.3%, a difference of 0.070%), Immigrants from Congo (2.3%, a difference of 0.090%), Immigrants from Portugal (2.3%, a difference of 0.14%), German Russian (2.3%, a difference of 0.27%), and Immigrants from Cambodia (2.3%, a difference of 0.41%). Similarly, the demographic groups most similar to Central Americans are German Russian (2.3%, a difference of 0.020%), Scottish (2.3%, a difference of 0.18%), Immigrants from Ecuador (2.3%, a difference of 0.20%), Immigrants from Congo (2.3%, a difference of 0.34%), and Nicaraguan (2.3%, a difference of 0.36%).
| Demographics | Rating | Rank | Vision Disability |
| Irish | 3.4 /100 | #224 | Tragic 2.3% |
| Immigrants | Western Africa | 3.4 /100 | #225 | Tragic 2.3% |
| Immigrants | Germany | 3.0 /100 | #226 | Tragic 2.3% |
| Hawaiians | 2.9 /100 | #227 | Tragic 2.3% |
| Hmong | 2.5 /100 | #228 | Tragic 2.3% |
| Welsh | 2.3 /100 | #229 | Tragic 2.3% |
| Nicaraguans | 2.2 /100 | #230 | Tragic 2.3% |
| Immigrants | Ecuador | 2.0 /100 | #231 | Tragic 2.3% |
| German Russians | 1.8 /100 | #232 | Tragic 2.3% |
| Central Americans | 1.8 /100 | #233 | Tragic 2.3% |
| Scottish | 1.6 /100 | #234 | Tragic 2.3% |
| Marshallese | 1.5 /100 | #235 | Tragic 2.3% |
| Immigrants | Congo | 1.4 /100 | #236 | Tragic 2.3% |
| Immigrants | Portugal | 1.4 /100 | #237 | Tragic 2.3% |
| Immigrants | Cambodia | 1.1 /100 | #238 | Tragic 2.3% |
| English | 1.1 /100 | #239 | Tragic 2.3% |
| Panamanians | 0.9 /100 | #240 | Tragic 2.3% |
| Malaysians | 0.9 /100 | #241 | Tragic 2.3% |
| Immigrants | Panama | 0.8 /100 | #242 | Tragic 2.3% |
| Immigrants | Nicaragua | 0.6 /100 | #243 | Tragic 2.3% |
| Immigrants | West Indies | 0.6 /100 | #244 | Tragic 2.3% |