British vs Central American Vision Disability
COMPARE
British
Central American
Vision Disability
Vision Disability Comparison
British
Central Americans
2.2%
VISION DISABILITY
25.1/ 100
METRIC RATING
193rd/ 347
METRIC RANK
2.3%
VISION DISABILITY
1.8/ 100
METRIC RATING
233rd/ 347
METRIC RANK
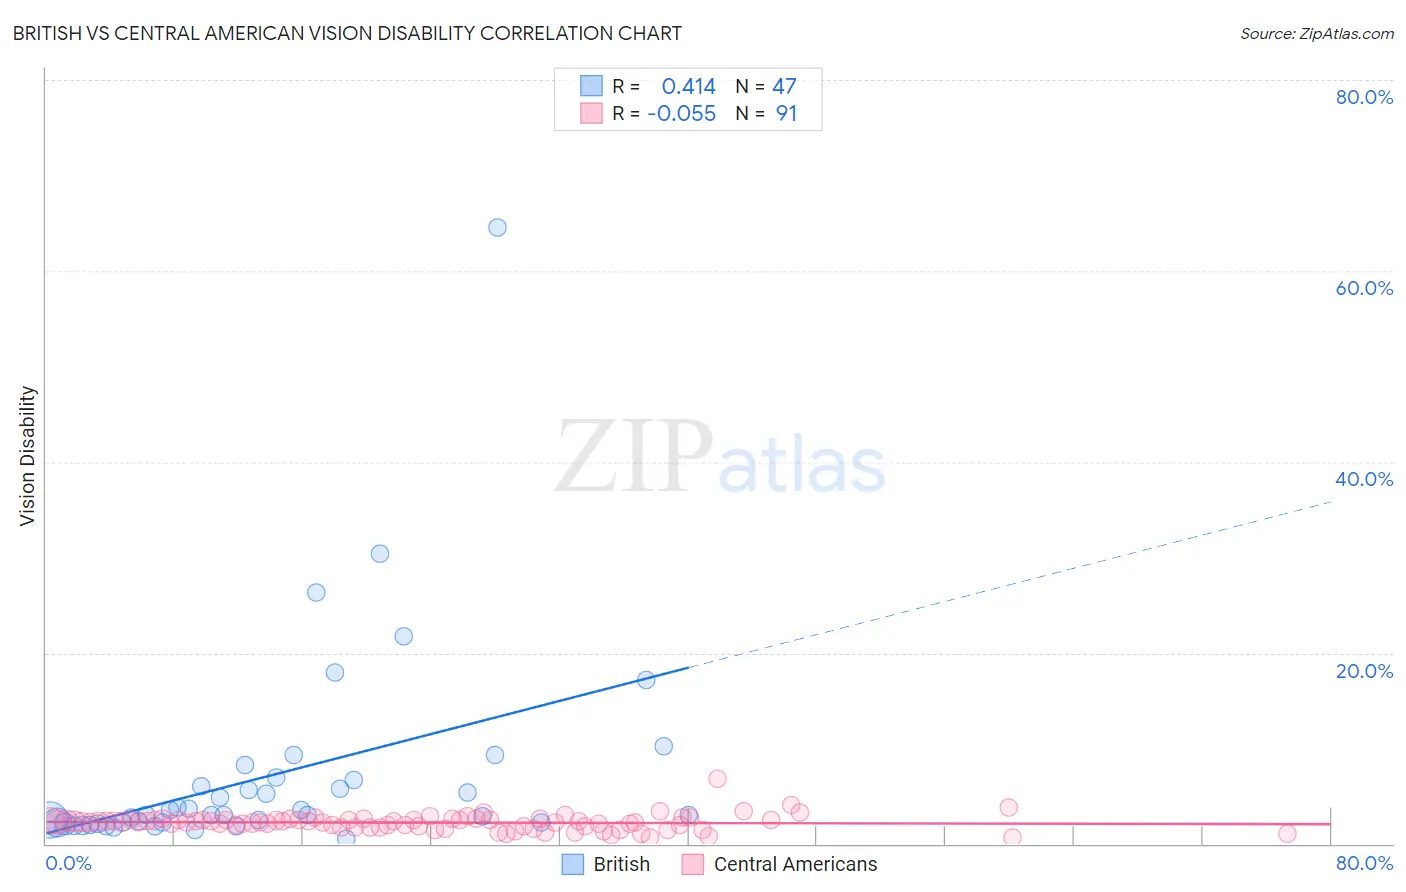
British vs Central American Vision Disability Correlation Chart
The statistical analysis conducted on geographies consisting of 530,471,861 people shows a moderate positive correlation between the proportion of British and percentage of population with vision disability in the United States with a correlation coefficient (R) of 0.414 and weighted average of 2.2%. Similarly, the statistical analysis conducted on geographies consisting of 503,926,566 people shows a slight negative correlation between the proportion of Central Americans and percentage of population with vision disability in the United States with a correlation coefficient (R) of -0.055 and weighted average of 2.3%, a difference of 4.5%.
Vision Disability Correlation Summary
| Measurement | British | Central American |
| Minimum | 0.53% | 0.66% |
| Maximum | 64.6% | 6.9% |
| Range | 64.1% | 6.2% |
| Mean | 7.1% | 2.2% |
| Median | 3.0% | 2.3% |
| Interquartile 25% (IQ1) | 2.2% | 1.8% |
| Interquartile 75% (IQ3) | 6.6% | 2.5% |
| Interquartile Range (IQR) | 4.5% | 0.71% |
| Standard Deviation (Sample) | 10.8% | 0.81% |
| Standard Deviation (Population) | 10.7% | 0.81% |
Similar Demographics by Vision Disability
Demographics Similar to British by Vision Disability
In terms of vision disability, the demographic groups most similar to British are European (2.2%, a difference of 0.050%), Canadian (2.2%, a difference of 0.060%), Immigrants from Costa Rica (2.2%, a difference of 0.080%), Immigrants from Barbados (2.2%, a difference of 0.090%), and Immigrants (2.2%, a difference of 0.11%).
| Demographics | Rating | Rank | Vision Disability |
| Native Hawaiians | 33.3 /100 | #186 | Fair 2.2% |
| Immigrants | St. Vincent and the Grenadines | 30.3 /100 | #187 | Fair 2.2% |
| Guyanese | 28.9 /100 | #188 | Fair 2.2% |
| Salvadorans | 27.4 /100 | #189 | Fair 2.2% |
| Immigrants | Costa Rica | 26.1 /100 | #190 | Fair 2.2% |
| Canadians | 25.8 /100 | #191 | Fair 2.2% |
| Europeans | 25.7 /100 | #192 | Fair 2.2% |
| British | 25.1 /100 | #193 | Fair 2.2% |
| Immigrants | Barbados | 24.0 /100 | #194 | Fair 2.2% |
| Immigrants | Immigrants | 23.7 /100 | #195 | Fair 2.2% |
| Immigrants | Grenada | 23.1 /100 | #196 | Fair 2.2% |
| Ghanaians | 21.8 /100 | #197 | Fair 2.2% |
| Czechoslovakians | 21.6 /100 | #198 | Fair 2.2% |
| Immigrants | El Salvador | 21.0 /100 | #199 | Fair 2.2% |
| Immigrants | Thailand | 20.1 /100 | #200 | Fair 2.2% |
Demographics Similar to Central Americans by Vision Disability
In terms of vision disability, the demographic groups most similar to Central Americans are German Russian (2.3%, a difference of 0.020%), Scottish (2.3%, a difference of 0.18%), Immigrants from Ecuador (2.3%, a difference of 0.20%), Marshallese (2.3%, a difference of 0.25%), and Immigrants from Congo (2.3%, a difference of 0.34%).
| Demographics | Rating | Rank | Vision Disability |
| Immigrants | Germany | 3.0 /100 | #226 | Tragic 2.3% |
| Hawaiians | 2.9 /100 | #227 | Tragic 2.3% |
| Hmong | 2.5 /100 | #228 | Tragic 2.3% |
| Welsh | 2.3 /100 | #229 | Tragic 2.3% |
| Nicaraguans | 2.2 /100 | #230 | Tragic 2.3% |
| Immigrants | Ecuador | 2.0 /100 | #231 | Tragic 2.3% |
| German Russians | 1.8 /100 | #232 | Tragic 2.3% |
| Central Americans | 1.8 /100 | #233 | Tragic 2.3% |
| Scottish | 1.6 /100 | #234 | Tragic 2.3% |
| Marshallese | 1.5 /100 | #235 | Tragic 2.3% |
| Immigrants | Congo | 1.4 /100 | #236 | Tragic 2.3% |
| Immigrants | Portugal | 1.4 /100 | #237 | Tragic 2.3% |
| Immigrants | Cambodia | 1.1 /100 | #238 | Tragic 2.3% |
| English | 1.1 /100 | #239 | Tragic 2.3% |
| Panamanians | 0.9 /100 | #240 | Tragic 2.3% |