Pakistani vs Central American Cognitive Disability
COMPARE
Pakistani
Central American
Cognitive Disability
Cognitive Disability Comparison
Pakistanis
Central Americans
17.3%
COGNITIVE DISABILITY
43.9/ 100
METRIC RATING
180th/ 347
METRIC RANK
17.7%
COGNITIVE DISABILITY
4.5/ 100
METRIC RATING
222nd/ 347
METRIC RANK
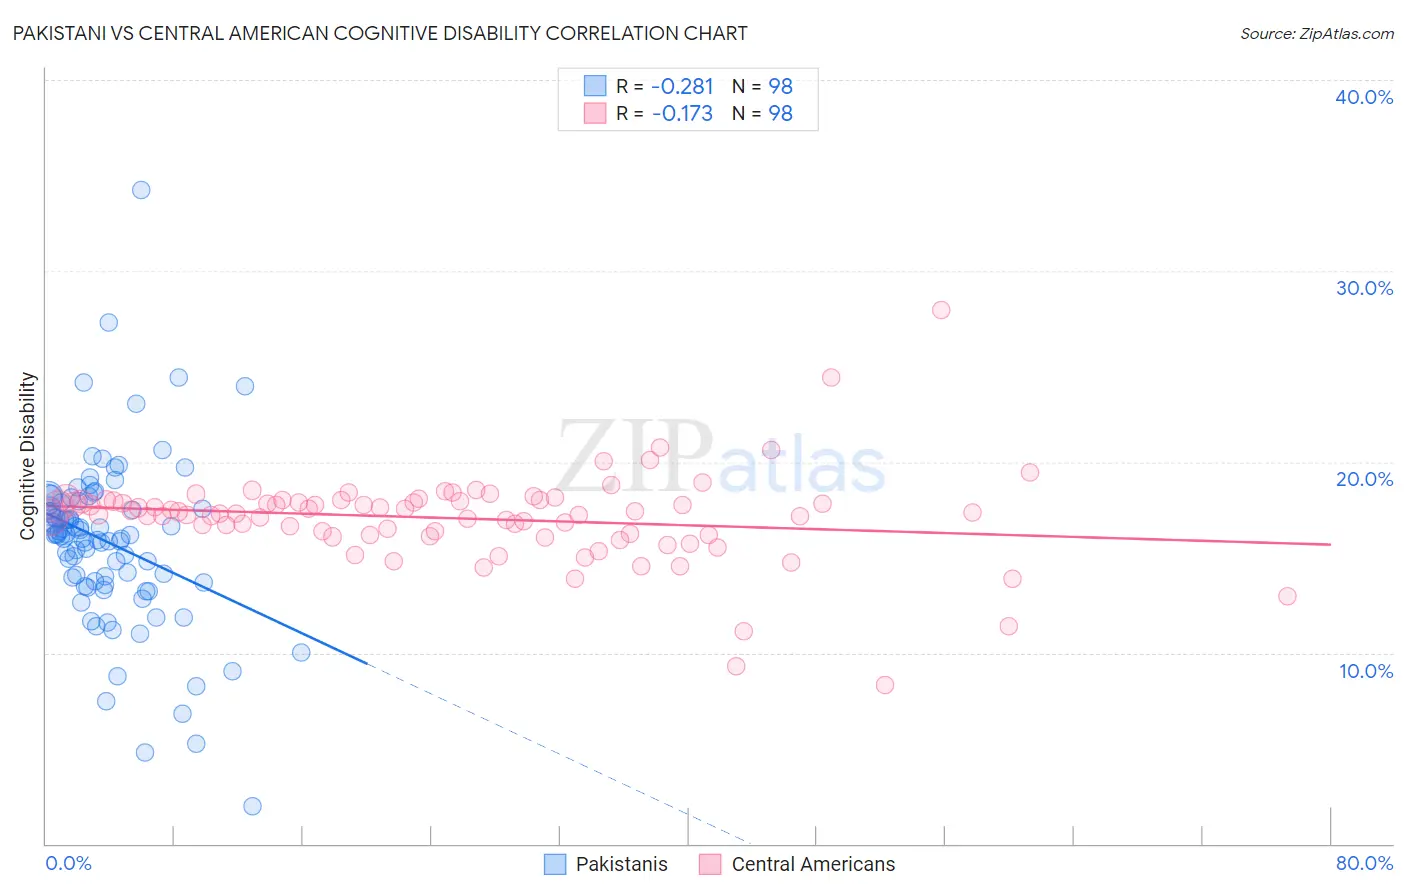
Pakistani vs Central American Cognitive Disability Correlation Chart
The statistical analysis conducted on geographies consisting of 335,302,267 people shows a weak negative correlation between the proportion of Pakistanis and percentage of population with cognitive disability in the United States with a correlation coefficient (R) of -0.281 and weighted average of 17.3%. Similarly, the statistical analysis conducted on geographies consisting of 504,492,457 people shows a poor negative correlation between the proportion of Central Americans and percentage of population with cognitive disability in the United States with a correlation coefficient (R) of -0.173 and weighted average of 17.7%, a difference of 2.0%.
Cognitive Disability Correlation Summary
| Measurement | Pakistani | Central American |
| Minimum | 2.0% | 8.3% |
| Maximum | 34.2% | 27.9% |
| Range | 32.2% | 19.6% |
| Mean | 15.8% | 17.0% |
| Median | 16.2% | 17.3% |
| Interquartile 25% (IQ1) | 13.7% | 16.2% |
| Interquartile 75% (IQ3) | 17.9% | 18.0% |
| Interquartile Range (IQR) | 4.2% | 1.8% |
| Standard Deviation (Sample) | 4.5% | 2.4% |
| Standard Deviation (Population) | 4.4% | 2.4% |
Similar Demographics by Cognitive Disability
Demographics Similar to Pakistanis by Cognitive Disability
In terms of cognitive disability, the demographic groups most similar to Pakistanis are Immigrants from Guyana (17.3%, a difference of 0.030%), Arab (17.3%, a difference of 0.030%), Spaniard (17.3%, a difference of 0.10%), Sioux (17.3%, a difference of 0.13%), and Spanish (17.3%, a difference of 0.14%).
| Demographics | Rating | Rank | Cognitive Disability |
| Immigrants | Northern Africa | 50.2 /100 | #173 | Average 17.3% |
| Laotians | 50.0 /100 | #174 | Average 17.3% |
| Tsimshian | 49.8 /100 | #175 | Average 17.3% |
| Shoshone | 49.2 /100 | #176 | Average 17.3% |
| Ute | 49.1 /100 | #177 | Average 17.3% |
| Spanish | 48.9 /100 | #178 | Average 17.3% |
| Sioux | 48.6 /100 | #179 | Average 17.3% |
| Pakistanis | 43.9 /100 | #180 | Average 17.3% |
| Immigrants | Guyana | 42.9 /100 | #181 | Average 17.3% |
| Arabs | 42.8 /100 | #182 | Average 17.3% |
| Spaniards | 40.3 /100 | #183 | Average 17.3% |
| Crow | 39.1 /100 | #184 | Fair 17.3% |
| Afghans | 38.2 /100 | #185 | Fair 17.3% |
| Cambodians | 35.9 /100 | #186 | Fair 17.3% |
| Immigrants | Fiji | 33.7 /100 | #187 | Fair 17.4% |
Demographics Similar to Central Americans by Cognitive Disability
In terms of cognitive disability, the demographic groups most similar to Central Americans are Alsatian (17.7%, a difference of 0.010%), Moroccan (17.6%, a difference of 0.20%), Fijian (17.7%, a difference of 0.20%), Vietnamese (17.7%, a difference of 0.21%), and Zimbabwean (17.6%, a difference of 0.22%).
| Demographics | Rating | Rank | Cognitive Disability |
| Alaskan Athabascans | 6.9 /100 | #215 | Tragic 17.6% |
| Okinawans | 6.8 /100 | #216 | Tragic 17.6% |
| Salvadorans | 6.7 /100 | #217 | Tragic 17.6% |
| Icelanders | 6.4 /100 | #218 | Tragic 17.6% |
| Immigrants | Sierra Leone | 6.3 /100 | #219 | Tragic 17.6% |
| Zimbabweans | 6.1 /100 | #220 | Tragic 17.6% |
| Moroccans | 5.9 /100 | #221 | Tragic 17.6% |
| Central Americans | 4.5 /100 | #222 | Tragic 17.7% |
| Alsatians | 4.5 /100 | #223 | Tragic 17.7% |
| Fijians | 3.4 /100 | #224 | Tragic 17.7% |
| Vietnamese | 3.4 /100 | #225 | Tragic 17.7% |
| Marshallese | 2.7 /100 | #226 | Tragic 17.7% |
| Immigrants | St. Vincent and the Grenadines | 2.6 /100 | #227 | Tragic 17.7% |
| Immigrants | Central America | 2.3 /100 | #228 | Tragic 17.7% |
| Immigrants | Guatemala | 2.2 /100 | #229 | Tragic 17.7% |