Paiute vs Immigrants from Western Africa Ambulatory Disability
COMPARE
Paiute
Immigrants from Western Africa
Ambulatory Disability
Ambulatory Disability Comparison
Paiute
Immigrants from Western Africa
7.7%
AMBULATORY DISABILITY
0.0/ 100
METRIC RATING
330th/ 347
METRIC RANK
6.2%
AMBULATORY DISABILITY
33.4/ 100
METRIC RATING
190th/ 347
METRIC RANK
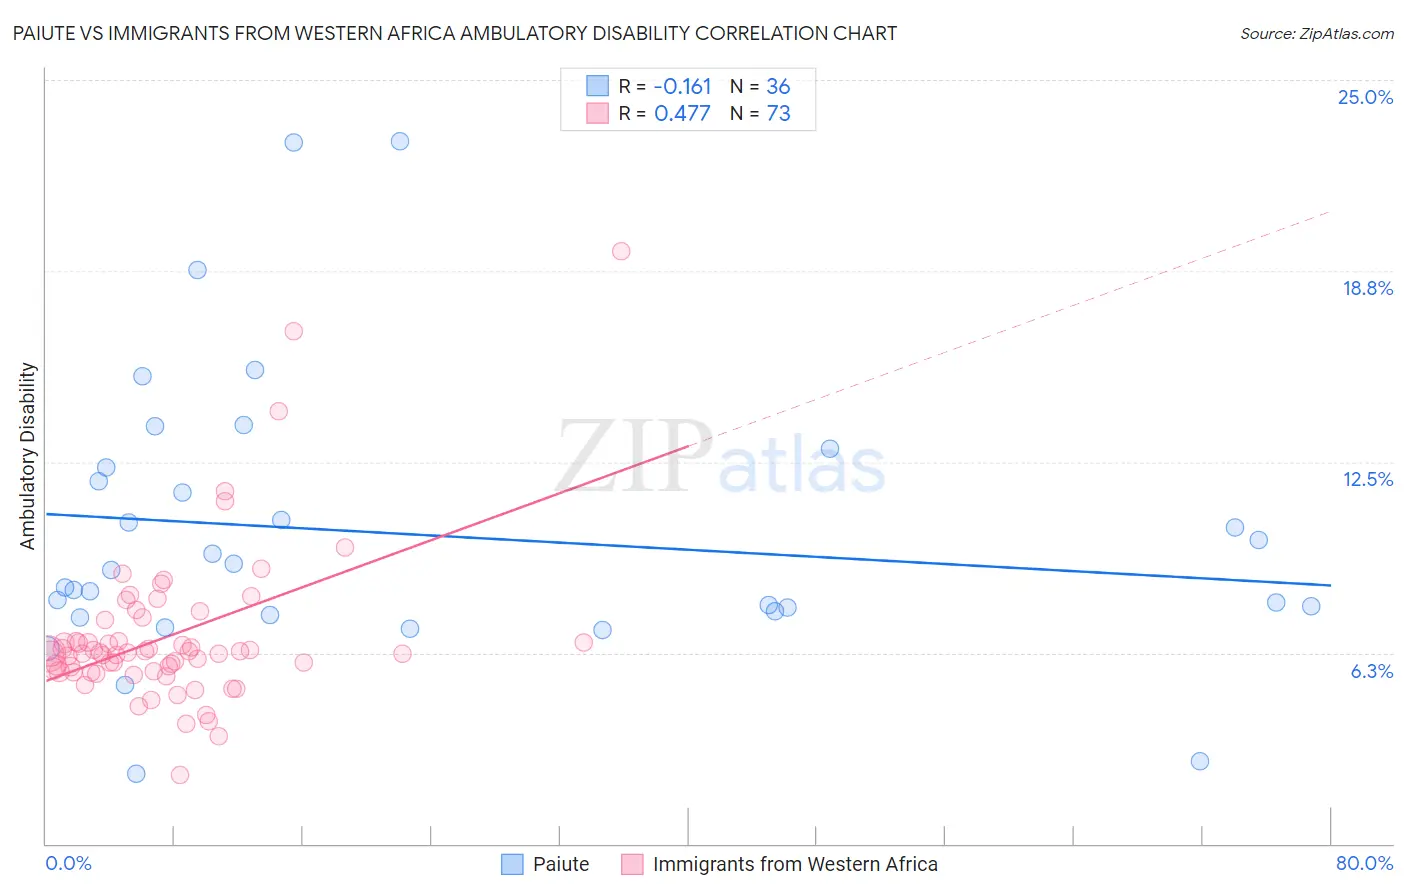
Paiute vs Immigrants from Western Africa Ambulatory Disability Correlation Chart
The statistical analysis conducted on geographies consisting of 58,391,383 people shows a poor negative correlation between the proportion of Paiute and percentage of population with ambulatory disability in the United States with a correlation coefficient (R) of -0.161 and weighted average of 7.7%. Similarly, the statistical analysis conducted on geographies consisting of 357,681,039 people shows a moderate positive correlation between the proportion of Immigrants from Western Africa and percentage of population with ambulatory disability in the United States with a correlation coefficient (R) of 0.477 and weighted average of 6.2%, a difference of 24.6%.
Ambulatory Disability Correlation Summary
| Measurement | Paiute | Immigrants from Western Africa |
| Minimum | 2.3% | 2.3% |
| Maximum | 23.0% | 19.4% |
| Range | 20.7% | 17.2% |
| Mean | 10.1% | 6.8% |
| Median | 8.7% | 6.2% |
| Interquartile 25% (IQ1) | 7.5% | 5.6% |
| Interquartile 75% (IQ3) | 12.1% | 7.0% |
| Interquartile Range (IQR) | 4.5% | 1.3% |
| Standard Deviation (Sample) | 4.6% | 2.6% |
| Standard Deviation (Population) | 4.6% | 2.6% |
Similar Demographics by Ambulatory Disability
Demographics Similar to Paiute by Ambulatory Disability
In terms of ambulatory disability, the demographic groups most similar to Paiute are Cajun (7.8%, a difference of 1.2%), Pueblo (7.6%, a difference of 1.3%), Hopi (7.6%, a difference of 1.3%), Menominee (7.8%, a difference of 1.5%), and Native/Alaskan (7.5%, a difference of 2.2%).
| Demographics | Rating | Rank | Ambulatory Disability |
| Americans | 0.0 /100 | #323 | Tragic 7.4% |
| Navajo | 0.0 /100 | #324 | Tragic 7.5% |
| Comanche | 0.0 /100 | #325 | Tragic 7.5% |
| Blacks/African Americans | 0.0 /100 | #326 | Tragic 7.5% |
| Natives/Alaskans | 0.0 /100 | #327 | Tragic 7.5% |
| Hopi | 0.0 /100 | #328 | Tragic 7.6% |
| Pueblo | 0.0 /100 | #329 | Tragic 7.6% |
| Paiute | 0.0 /100 | #330 | Tragic 7.7% |
| Cajuns | 0.0 /100 | #331 | Tragic 7.8% |
| Menominee | 0.0 /100 | #332 | Tragic 7.8% |
| Cherokee | 0.0 /100 | #333 | Tragic 7.9% |
| Yuman | 0.0 /100 | #334 | Tragic 7.9% |
| Chickasaw | 0.0 /100 | #335 | Tragic 8.0% |
| Seminole | 0.0 /100 | #336 | Tragic 8.0% |
| Dutch West Indians | 0.0 /100 | #337 | Tragic 8.2% |
Demographics Similar to Immigrants from Western Africa by Ambulatory Disability
In terms of ambulatory disability, the demographic groups most similar to Immigrants from Western Africa are Ukrainian (6.2%, a difference of 0.040%), British (6.2%, a difference of 0.050%), Immigrants from Guatemala (6.2%, a difference of 0.090%), Immigrants from Western Europe (6.2%, a difference of 0.10%), and Carpatho Rusyn (6.2%, a difference of 0.12%).
| Demographics | Rating | Rank | Ambulatory Disability |
| Immigrants | Thailand | 42.2 /100 | #183 | Average 6.1% |
| Immigrants | Ghana | 41.2 /100 | #184 | Average 6.1% |
| Immigrants | Bosnia and Herzegovina | 37.2 /100 | #185 | Fair 6.2% |
| Europeans | 36.2 /100 | #186 | Fair 6.2% |
| Carpatho Rusyns | 35.3 /100 | #187 | Fair 6.2% |
| British | 34.3 /100 | #188 | Fair 6.2% |
| Ukrainians | 34.0 /100 | #189 | Fair 6.2% |
| Immigrants | Western Africa | 33.4 /100 | #190 | Fair 6.2% |
| Immigrants | Guatemala | 31.9 /100 | #191 | Fair 6.2% |
| Immigrants | Western Europe | 31.6 /100 | #192 | Fair 6.2% |
| Guatemalans | 30.0 /100 | #193 | Fair 6.2% |
| Alaska Natives | 29.8 /100 | #194 | Fair 6.2% |
| Belgians | 28.6 /100 | #195 | Fair 6.2% |
| Malaysians | 28.2 /100 | #196 | Fair 6.2% |
| Poles | 26.3 /100 | #197 | Fair 6.2% |