Immigrants from Canada vs Immigrants from Western Africa Ambulatory Disability
COMPARE
Immigrants from Canada
Immigrants from Western Africa
Ambulatory Disability
Ambulatory Disability Comparison
Immigrants from Canada
Immigrants from Western Africa
6.1%
AMBULATORY DISABILITY
50.0/ 100
METRIC RATING
174th/ 347
METRIC RANK
6.2%
AMBULATORY DISABILITY
33.4/ 100
METRIC RATING
190th/ 347
METRIC RANK
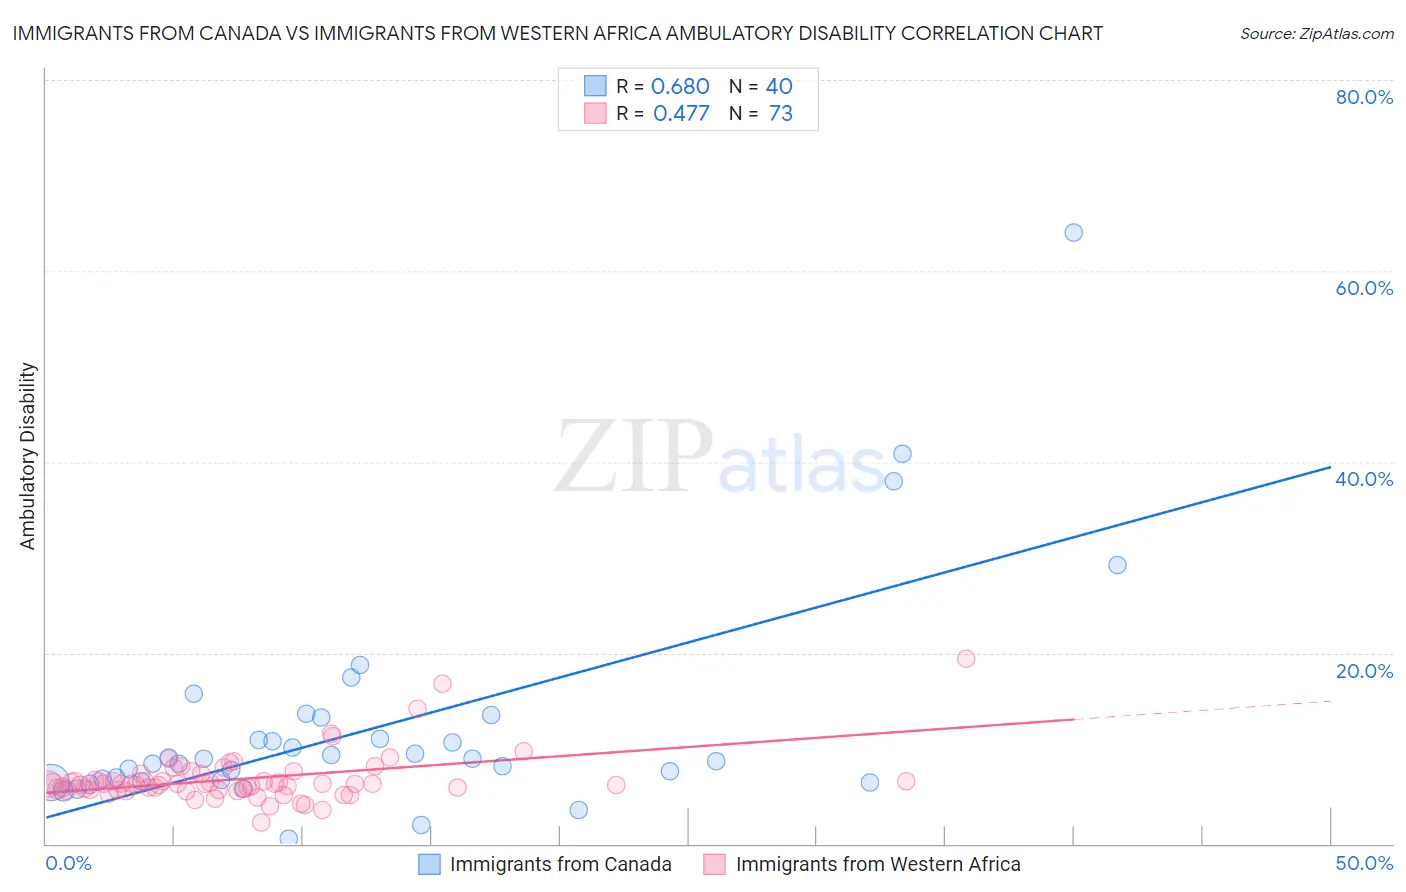
Immigrants from Canada vs Immigrants from Western Africa Ambulatory Disability Correlation Chart
The statistical analysis conducted on geographies consisting of 459,245,879 people shows a significant positive correlation between the proportion of Immigrants from Canada and percentage of population with ambulatory disability in the United States with a correlation coefficient (R) of 0.680 and weighted average of 6.1%. Similarly, the statistical analysis conducted on geographies consisting of 357,681,039 people shows a moderate positive correlation between the proportion of Immigrants from Western Africa and percentage of population with ambulatory disability in the United States with a correlation coefficient (R) of 0.477 and weighted average of 6.2%, a difference of 0.92%.
Ambulatory Disability Correlation Summary
| Measurement | Immigrants from Canada | Immigrants from Western Africa |
| Minimum | 0.55% | 2.3% |
| Maximum | 64.0% | 19.4% |
| Range | 63.4% | 17.2% |
| Mean | 12.2% | 6.8% |
| Median | 8.8% | 6.2% |
| Interquartile 25% (IQ1) | 6.6% | 5.6% |
| Interquartile 75% (IQ3) | 12.1% | 7.0% |
| Interquartile Range (IQR) | 5.5% | 1.3% |
| Standard Deviation (Sample) | 11.8% | 2.6% |
| Standard Deviation (Population) | 11.6% | 2.6% |
Demographics Similar to Immigrants from Canada and Immigrants from Western Africa by Ambulatory Disability
In terms of ambulatory disability, the demographic groups most similar to Immigrants from Canada are Croatian (6.1%, a difference of 0.060%), Immigrants from Burma/Myanmar (6.1%, a difference of 0.11%), Vietnamese (6.1%, a difference of 0.15%), Immigrants from North America (6.1%, a difference of 0.23%), and Immigrants from England (6.1%, a difference of 0.25%). Similarly, the demographic groups most similar to Immigrants from Western Africa are Ukrainian (6.2%, a difference of 0.040%), British (6.2%, a difference of 0.050%), Immigrants from Guatemala (6.2%, a difference of 0.090%), Immigrants from Western Europe (6.2%, a difference of 0.10%), and Carpatho Rusyn (6.2%, a difference of 0.12%).
| Demographics | Rating | Rank | Ambulatory Disability |
| Immigrants | Burma/Myanmar | 52.2 /100 | #172 | Average 6.1% |
| Croatians | 51.2 /100 | #173 | Average 6.1% |
| Immigrants | Canada | 50.0 /100 | #174 | Average 6.1% |
| Vietnamese | 47.2 /100 | #175 | Average 6.1% |
| Immigrants | North America | 45.6 /100 | #176 | Average 6.1% |
| Immigrants | England | 45.4 /100 | #177 | Average 6.1% |
| Scandinavians | 44.5 /100 | #178 | Average 6.1% |
| Austrians | 44.1 /100 | #179 | Average 6.1% |
| Immigrants | Nicaragua | 43.9 /100 | #180 | Average 6.1% |
| Swiss | 43.1 /100 | #181 | Average 6.1% |
| Serbians | 42.8 /100 | #182 | Average 6.1% |
| Immigrants | Thailand | 42.2 /100 | #183 | Average 6.1% |
| Immigrants | Ghana | 41.2 /100 | #184 | Average 6.1% |
| Immigrants | Bosnia and Herzegovina | 37.2 /100 | #185 | Fair 6.2% |
| Europeans | 36.2 /100 | #186 | Fair 6.2% |
| Carpatho Rusyns | 35.3 /100 | #187 | Fair 6.2% |
| British | 34.3 /100 | #188 | Fair 6.2% |
| Ukrainians | 34.0 /100 | #189 | Fair 6.2% |
| Immigrants | Western Africa | 33.4 /100 | #190 | Fair 6.2% |
| Immigrants | Guatemala | 31.9 /100 | #191 | Fair 6.2% |
| Immigrants | Western Europe | 31.6 /100 | #192 | Fair 6.2% |