Paiute vs Immigrants from Venezuela Ambulatory Disability
COMPARE
Paiute
Immigrants from Venezuela
Ambulatory Disability
Ambulatory Disability Comparison
Paiute
Immigrants from Venezuela
7.7%
AMBULATORY DISABILITY
0.0/ 100
METRIC RATING
330th/ 347
METRIC RANK
5.4%
AMBULATORY DISABILITY
100.0/ 100
METRIC RATING
31st/ 347
METRIC RANK
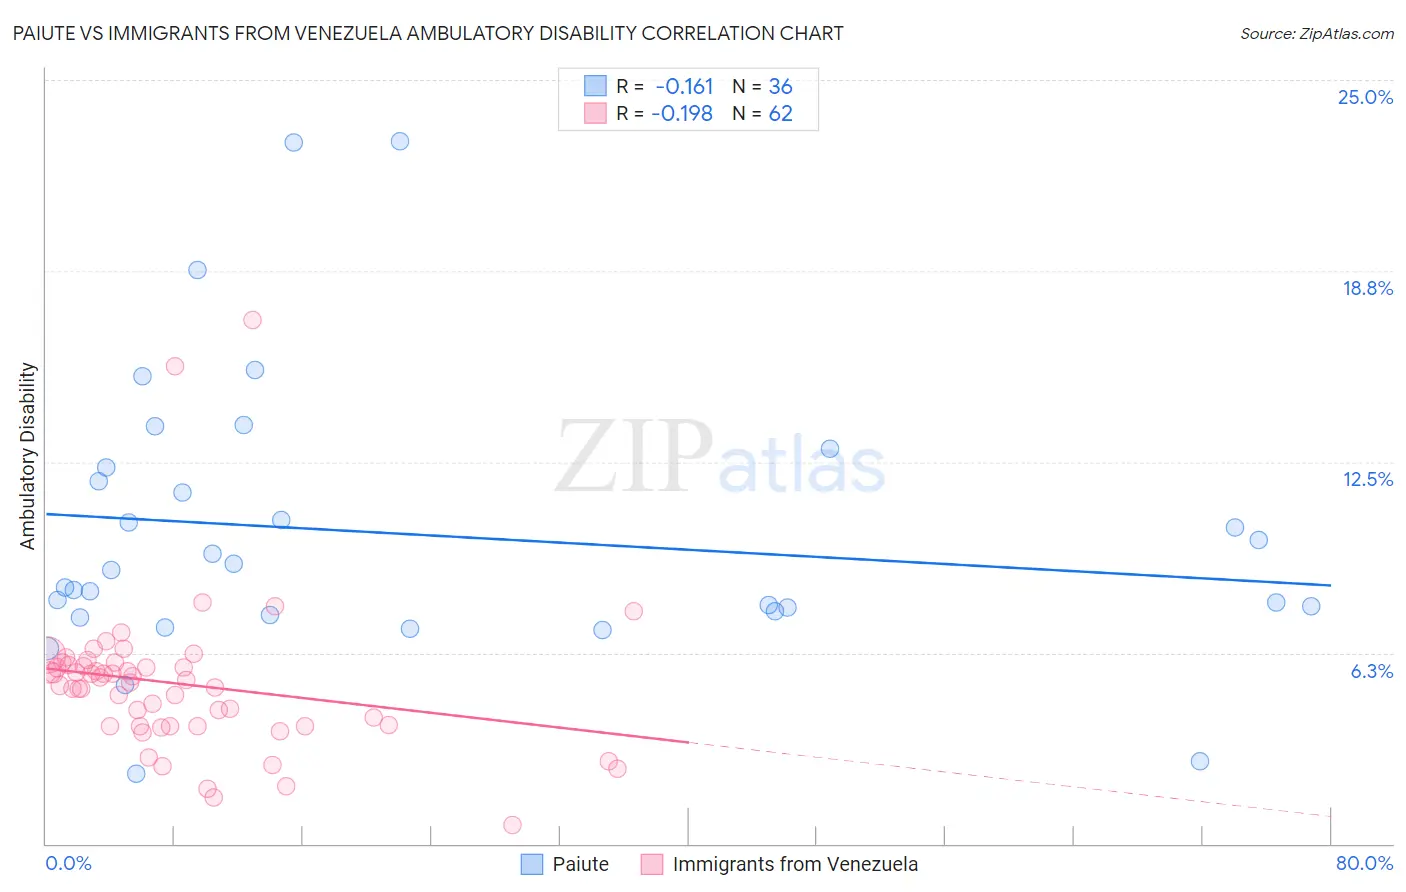
Paiute vs Immigrants from Venezuela Ambulatory Disability Correlation Chart
The statistical analysis conducted on geographies consisting of 58,391,383 people shows a poor negative correlation between the proportion of Paiute and percentage of population with ambulatory disability in the United States with a correlation coefficient (R) of -0.161 and weighted average of 7.7%. Similarly, the statistical analysis conducted on geographies consisting of 287,823,079 people shows a poor negative correlation between the proportion of Immigrants from Venezuela and percentage of population with ambulatory disability in the United States with a correlation coefficient (R) of -0.198 and weighted average of 5.4%, a difference of 41.2%.
Ambulatory Disability Correlation Summary
| Measurement | Paiute | Immigrants from Venezuela |
| Minimum | 2.3% | 0.63% |
| Maximum | 23.0% | 17.1% |
| Range | 20.7% | 16.5% |
| Mean | 10.1% | 5.2% |
| Median | 8.7% | 5.3% |
| Interquartile 25% (IQ1) | 7.5% | 3.8% |
| Interquartile 75% (IQ3) | 12.1% | 5.8% |
| Interquartile Range (IQR) | 4.5% | 2.0% |
| Standard Deviation (Sample) | 4.6% | 2.6% |
| Standard Deviation (Population) | 4.6% | 2.5% |
Similar Demographics by Ambulatory Disability
Demographics Similar to Paiute by Ambulatory Disability
In terms of ambulatory disability, the demographic groups most similar to Paiute are Cajun (7.8%, a difference of 1.2%), Pueblo (7.6%, a difference of 1.3%), Hopi (7.6%, a difference of 1.3%), Menominee (7.8%, a difference of 1.5%), and Native/Alaskan (7.5%, a difference of 2.2%).
| Demographics | Rating | Rank | Ambulatory Disability |
| Americans | 0.0 /100 | #323 | Tragic 7.4% |
| Navajo | 0.0 /100 | #324 | Tragic 7.5% |
| Comanche | 0.0 /100 | #325 | Tragic 7.5% |
| Blacks/African Americans | 0.0 /100 | #326 | Tragic 7.5% |
| Natives/Alaskans | 0.0 /100 | #327 | Tragic 7.5% |
| Hopi | 0.0 /100 | #328 | Tragic 7.6% |
| Pueblo | 0.0 /100 | #329 | Tragic 7.6% |
| Paiute | 0.0 /100 | #330 | Tragic 7.7% |
| Cajuns | 0.0 /100 | #331 | Tragic 7.8% |
| Menominee | 0.0 /100 | #332 | Tragic 7.8% |
| Cherokee | 0.0 /100 | #333 | Tragic 7.9% |
| Yuman | 0.0 /100 | #334 | Tragic 7.9% |
| Chickasaw | 0.0 /100 | #335 | Tragic 8.0% |
| Seminole | 0.0 /100 | #336 | Tragic 8.0% |
| Dutch West Indians | 0.0 /100 | #337 | Tragic 8.2% |
Demographics Similar to Immigrants from Venezuela by Ambulatory Disability
In terms of ambulatory disability, the demographic groups most similar to Immigrants from Venezuela are Immigrants from Turkey (5.4%, a difference of 0.020%), Immigrants from Australia (5.5%, a difference of 0.17%), Immigrants from Pakistan (5.5%, a difference of 0.29%), Immigrants from Asia (5.5%, a difference of 0.44%), and Afghan (5.5%, a difference of 0.49%).
| Demographics | Rating | Rank | Ambulatory Disability |
| Immigrants | Saudi Arabia | 100.0 /100 | #24 | Exceptional 5.4% |
| Zimbabweans | 100.0 /100 | #25 | Exceptional 5.4% |
| Immigrants | Nepal | 100.0 /100 | #26 | Exceptional 5.4% |
| Asians | 100.0 /100 | #27 | Exceptional 5.4% |
| Cambodians | 100.0 /100 | #28 | Exceptional 5.4% |
| Immigrants | Iran | 100.0 /100 | #29 | Exceptional 5.4% |
| Immigrants | Turkey | 100.0 /100 | #30 | Exceptional 5.4% |
| Immigrants | Venezuela | 100.0 /100 | #31 | Exceptional 5.4% |
| Immigrants | Australia | 100.0 /100 | #32 | Exceptional 5.5% |
| Immigrants | Pakistan | 100.0 /100 | #33 | Exceptional 5.5% |
| Immigrants | Asia | 100.0 /100 | #34 | Exceptional 5.5% |
| Afghans | 100.0 /100 | #35 | Exceptional 5.5% |
| Immigrants | Malaysia | 100.0 /100 | #36 | Exceptional 5.5% |
| Turks | 100.0 /100 | #37 | Exceptional 5.5% |
| Cypriots | 100.0 /100 | #38 | Exceptional 5.5% |