Immigrants from Jordan vs Immigrants from Western Africa Ambulatory Disability
COMPARE
Immigrants from Jordan
Immigrants from Western Africa
Ambulatory Disability
Ambulatory Disability Comparison
Immigrants from Jordan
Immigrants from Western Africa
5.7%
AMBULATORY DISABILITY
99.2/ 100
METRIC RATING
81st/ 347
METRIC RANK
6.2%
AMBULATORY DISABILITY
33.4/ 100
METRIC RATING
190th/ 347
METRIC RANK
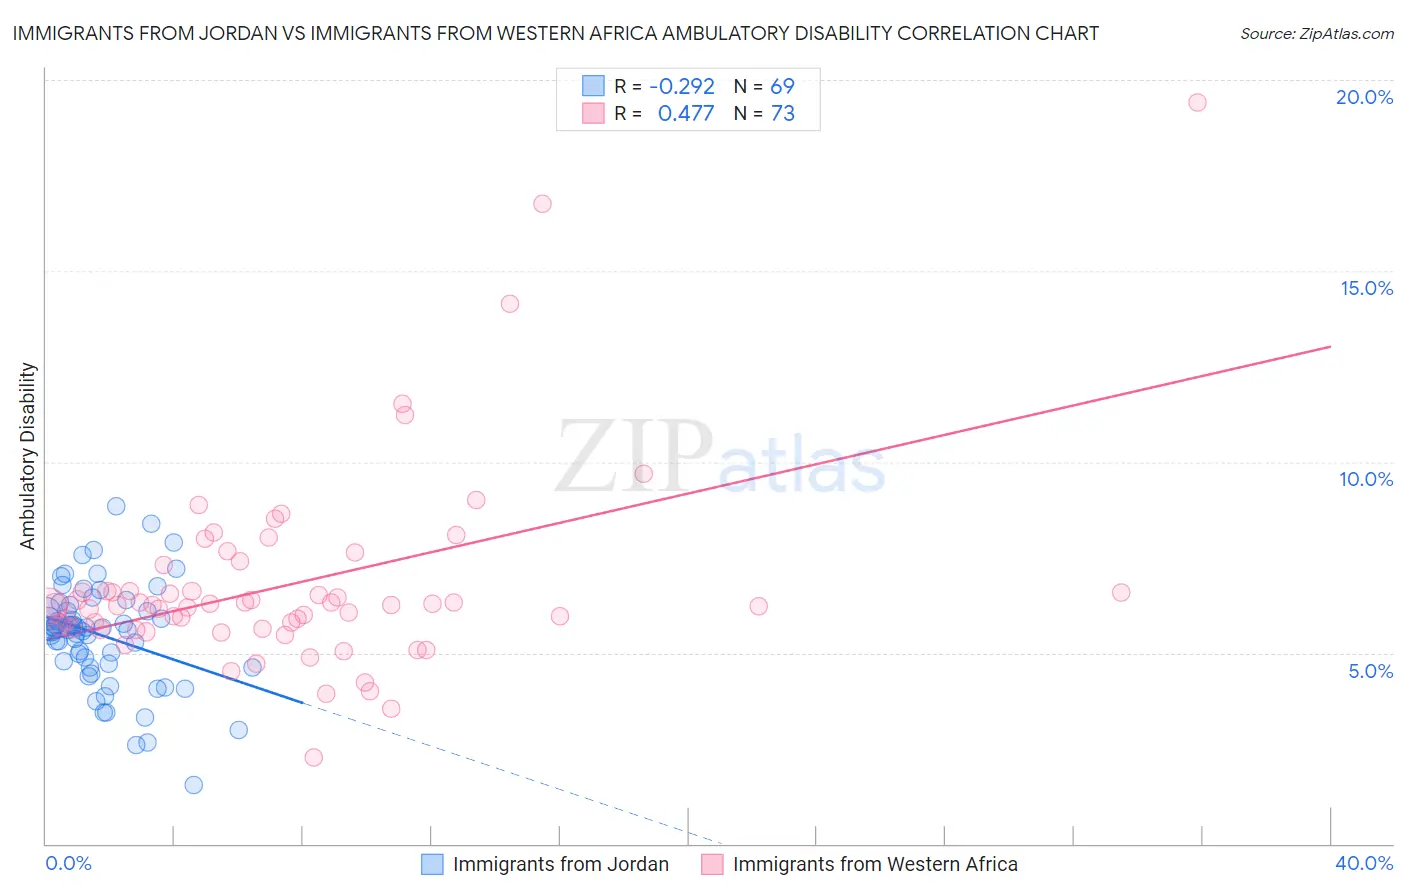
Immigrants from Jordan vs Immigrants from Western Africa Ambulatory Disability Correlation Chart
The statistical analysis conducted on geographies consisting of 181,269,756 people shows a weak negative correlation between the proportion of Immigrants from Jordan and percentage of population with ambulatory disability in the United States with a correlation coefficient (R) of -0.292 and weighted average of 5.7%. Similarly, the statistical analysis conducted on geographies consisting of 357,681,039 people shows a moderate positive correlation between the proportion of Immigrants from Western Africa and percentage of population with ambulatory disability in the United States with a correlation coefficient (R) of 0.477 and weighted average of 6.2%, a difference of 7.7%.
Ambulatory Disability Correlation Summary
| Measurement | Immigrants from Jordan | Immigrants from Western Africa |
| Minimum | 1.5% | 2.3% |
| Maximum | 8.9% | 19.4% |
| Range | 7.3% | 17.2% |
| Mean | 5.5% | 6.8% |
| Median | 5.6% | 6.2% |
| Interquartile 25% (IQ1) | 4.7% | 5.6% |
| Interquartile 75% (IQ3) | 6.2% | 7.0% |
| Interquartile Range (IQR) | 1.5% | 1.3% |
| Standard Deviation (Sample) | 1.4% | 2.6% |
| Standard Deviation (Population) | 1.4% | 2.6% |
Similar Demographics by Ambulatory Disability
Demographics Similar to Immigrants from Jordan by Ambulatory Disability
In terms of ambulatory disability, the demographic groups most similar to Immigrants from Jordan are Palestinian (5.7%, a difference of 0.0%), Immigrants from Ireland (5.7%, a difference of 0.010%), Eastern European (5.7%, a difference of 0.020%), Ugandan (5.7%, a difference of 0.030%), and Somali (5.7%, a difference of 0.14%).
| Demographics | Rating | Rank | Ambulatory Disability |
| Immigrants | Cameroon | 99.4 /100 | #74 | Exceptional 5.7% |
| Immigrants | South Africa | 99.3 /100 | #75 | Exceptional 5.7% |
| Sudanese | 99.3 /100 | #76 | Exceptional 5.7% |
| Immigrants | Vietnam | 99.3 /100 | #77 | Exceptional 5.7% |
| Somalis | 99.2 /100 | #78 | Exceptional 5.7% |
| Chileans | 99.2 /100 | #79 | Exceptional 5.7% |
| Immigrants | Ireland | 99.2 /100 | #80 | Exceptional 5.7% |
| Immigrants | Jordan | 99.2 /100 | #81 | Exceptional 5.7% |
| Palestinians | 99.2 /100 | #82 | Exceptional 5.7% |
| Eastern Europeans | 99.2 /100 | #83 | Exceptional 5.7% |
| Ugandans | 99.2 /100 | #84 | Exceptional 5.7% |
| South Americans | 99.0 /100 | #85 | Exceptional 5.7% |
| Latvians | 99.0 /100 | #86 | Exceptional 5.7% |
| Immigrants | Chile | 98.9 /100 | #87 | Exceptional 5.8% |
| Soviet Union | 98.9 /100 | #88 | Exceptional 5.8% |
Demographics Similar to Immigrants from Western Africa by Ambulatory Disability
In terms of ambulatory disability, the demographic groups most similar to Immigrants from Western Africa are Ukrainian (6.2%, a difference of 0.040%), British (6.2%, a difference of 0.050%), Immigrants from Guatemala (6.2%, a difference of 0.090%), Immigrants from Western Europe (6.2%, a difference of 0.10%), and Carpatho Rusyn (6.2%, a difference of 0.12%).
| Demographics | Rating | Rank | Ambulatory Disability |
| Immigrants | Thailand | 42.2 /100 | #183 | Average 6.1% |
| Immigrants | Ghana | 41.2 /100 | #184 | Average 6.1% |
| Immigrants | Bosnia and Herzegovina | 37.2 /100 | #185 | Fair 6.2% |
| Europeans | 36.2 /100 | #186 | Fair 6.2% |
| Carpatho Rusyns | 35.3 /100 | #187 | Fair 6.2% |
| British | 34.3 /100 | #188 | Fair 6.2% |
| Ukrainians | 34.0 /100 | #189 | Fair 6.2% |
| Immigrants | Western Africa | 33.4 /100 | #190 | Fair 6.2% |
| Immigrants | Guatemala | 31.9 /100 | #191 | Fair 6.2% |
| Immigrants | Western Europe | 31.6 /100 | #192 | Fair 6.2% |
| Guatemalans | 30.0 /100 | #193 | Fair 6.2% |
| Alaska Natives | 29.8 /100 | #194 | Fair 6.2% |
| Belgians | 28.6 /100 | #195 | Fair 6.2% |
| Malaysians | 28.2 /100 | #196 | Fair 6.2% |
| Poles | 26.3 /100 | #197 | Fair 6.2% |