Paiute vs Immigrants from Western Africa Unemployment Among Ages 16 to 19 years
COMPARE
Paiute
Immigrants from Western Africa
Unemployment Among Ages 16 to 19 years
Unemployment Among Ages 16 to 19 years Comparison
Paiute
Immigrants from Western Africa
24.4%
UNEMPLOYMENT AMONG AGES 16 TO 19 YEARS
0.0/ 100
METRIC RATING
333rd/ 347
METRIC RANK
19.4%
UNEMPLOYMENT AMONG AGES 16 TO 19 YEARS
0.0/ 100
METRIC RATING
277th/ 347
METRIC RANK
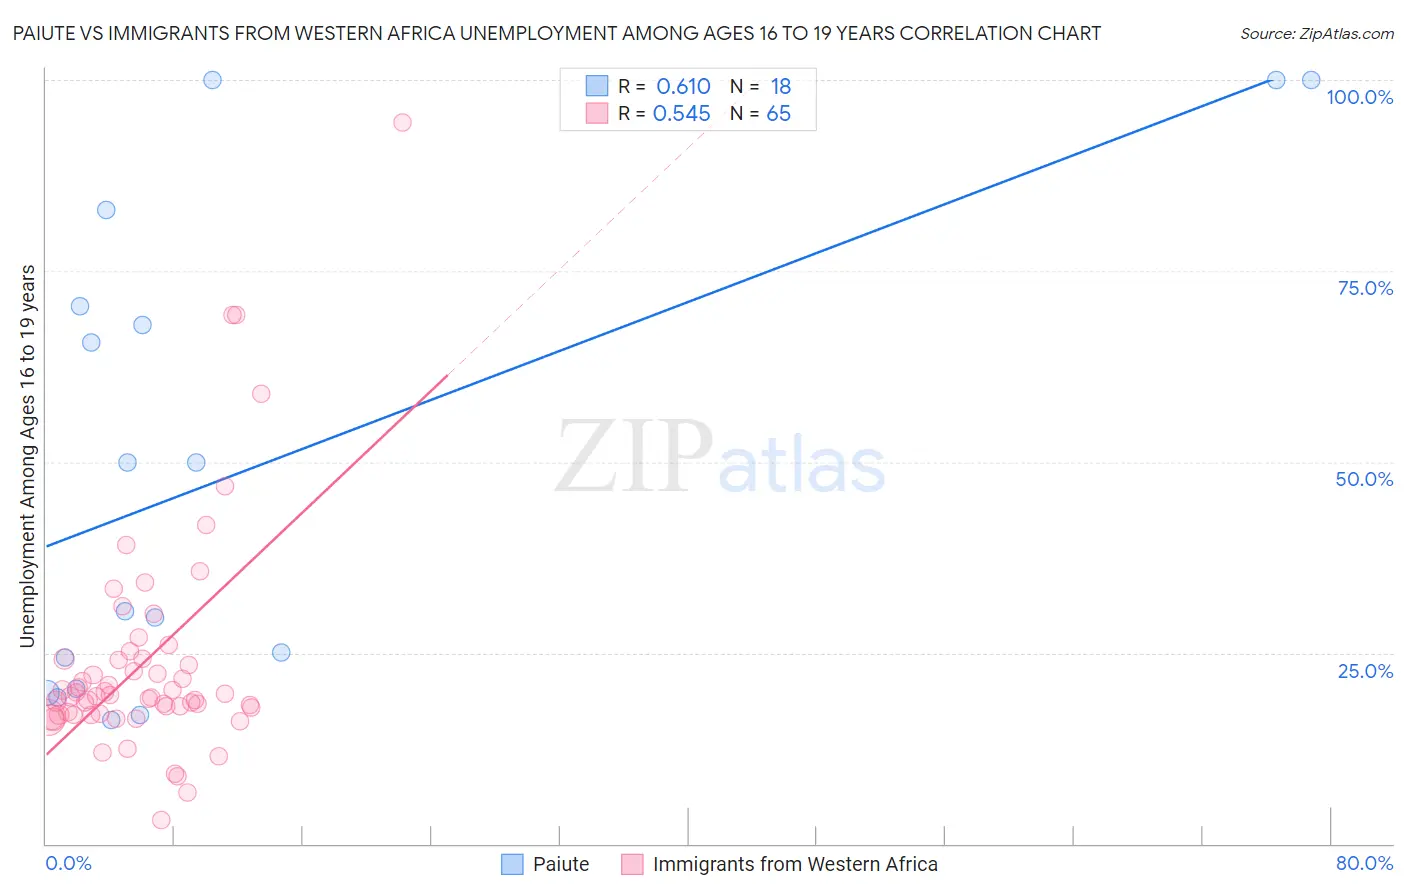
Paiute vs Immigrants from Western Africa Unemployment Among Ages 16 to 19 years Correlation Chart
The statistical analysis conducted on geographies consisting of 57,592,055 people shows a significant positive correlation between the proportion of Paiute and unemployment rate among population between the ages 16 and 19 in the United States with a correlation coefficient (R) of 0.610 and weighted average of 24.4%. Similarly, the statistical analysis conducted on geographies consisting of 344,855,911 people shows a substantial positive correlation between the proportion of Immigrants from Western Africa and unemployment rate among population between the ages 16 and 19 in the United States with a correlation coefficient (R) of 0.545 and weighted average of 19.4%, a difference of 25.3%.
Unemployment Among Ages 16 to 19 years Correlation Summary
| Measurement | Paiute | Immigrants from Western Africa |
| Minimum | 16.3% | 3.1% |
| Maximum | 100.0% | 94.4% |
| Range | 83.7% | 91.3% |
| Mean | 49.4% | 23.9% |
| Median | 40.2% | 19.3% |
| Interquartile 25% (IQ1) | 20.3% | 17.0% |
| Interquartile 75% (IQ3) | 70.4% | 24.2% |
| Interquartile Range (IQR) | 50.0% | 7.2% |
| Standard Deviation (Sample) | 31.3% | 15.1% |
| Standard Deviation (Population) | 30.4% | 15.0% |
Similar Demographics by Unemployment Among Ages 16 to 19 years
Demographics Similar to Paiute by Unemployment Among Ages 16 to 19 years
In terms of unemployment among ages 16 to 19 years, the demographic groups most similar to Paiute are Immigrants from Barbados (24.0%, a difference of 1.4%), British West Indian (24.0%, a difference of 1.6%), Guyanese (24.8%, a difference of 1.9%), Dominican (23.6%, a difference of 3.0%), and Arapaho (25.2%, a difference of 3.3%).
| Demographics | Rating | Rank | Unemployment Among Ages 16 to 19 years |
| Immigrants | Trinidad and Tobago | 0.0 /100 | #326 | Tragic 23.1% |
| Pima | 0.0 /100 | #327 | Tragic 23.1% |
| Immigrants | Dominican Republic | 0.0 /100 | #328 | Tragic 23.3% |
| Tlingit-Haida | 0.0 /100 | #329 | Tragic 23.5% |
| Dominicans | 0.0 /100 | #330 | Tragic 23.6% |
| British West Indians | 0.0 /100 | #331 | Tragic 24.0% |
| Immigrants | Barbados | 0.0 /100 | #332 | Tragic 24.0% |
| Paiute | 0.0 /100 | #333 | Tragic 24.4% |
| Guyanese | 0.0 /100 | #334 | Tragic 24.8% |
| Arapaho | 0.0 /100 | #335 | Tragic 25.2% |
| Kiowa | 0.0 /100 | #336 | Tragic 25.2% |
| Immigrants | Guyana | 0.0 /100 | #337 | Tragic 25.5% |
| Immigrants | St. Vincent and the Grenadines | 0.0 /100 | #338 | Tragic 25.7% |
| Immigrants | Grenada | 0.0 /100 | #339 | Tragic 25.7% |
| Crow | 0.0 /100 | #340 | Tragic 26.2% |
Demographics Similar to Immigrants from Western Africa by Unemployment Among Ages 16 to 19 years
In terms of unemployment among ages 16 to 19 years, the demographic groups most similar to Immigrants from Western Africa are African (19.5%, a difference of 0.23%), Immigrants from Latin America (19.4%, a difference of 0.33%), Paraguayan (19.4%, a difference of 0.42%), Ute (19.6%, a difference of 0.60%), and Cajun (19.6%, a difference of 0.72%).
| Demographics | Rating | Rank | Unemployment Among Ages 16 to 19 years |
| Hondurans | 0.1 /100 | #270 | Tragic 19.2% |
| Blackfeet | 0.0 /100 | #271 | Tragic 19.2% |
| Hispanics or Latinos | 0.0 /100 | #272 | Tragic 19.2% |
| Immigrants | Panama | 0.0 /100 | #273 | Tragic 19.3% |
| Shoshone | 0.0 /100 | #274 | Tragic 19.3% |
| Paraguayans | 0.0 /100 | #275 | Tragic 19.4% |
| Immigrants | Latin America | 0.0 /100 | #276 | Tragic 19.4% |
| Immigrants | Western Africa | 0.0 /100 | #277 | Tragic 19.4% |
| Africans | 0.0 /100 | #278 | Tragic 19.5% |
| Ute | 0.0 /100 | #279 | Tragic 19.6% |
| Cajuns | 0.0 /100 | #280 | Tragic 19.6% |
| Cypriots | 0.0 /100 | #281 | Tragic 19.6% |
| Dutch West Indians | 0.0 /100 | #282 | Tragic 19.7% |
| Sioux | 0.0 /100 | #283 | Tragic 19.7% |
| Sierra Leoneans | 0.0 /100 | #284 | Tragic 19.7% |